...
What follows are two ways to get to the Error Snapshots.
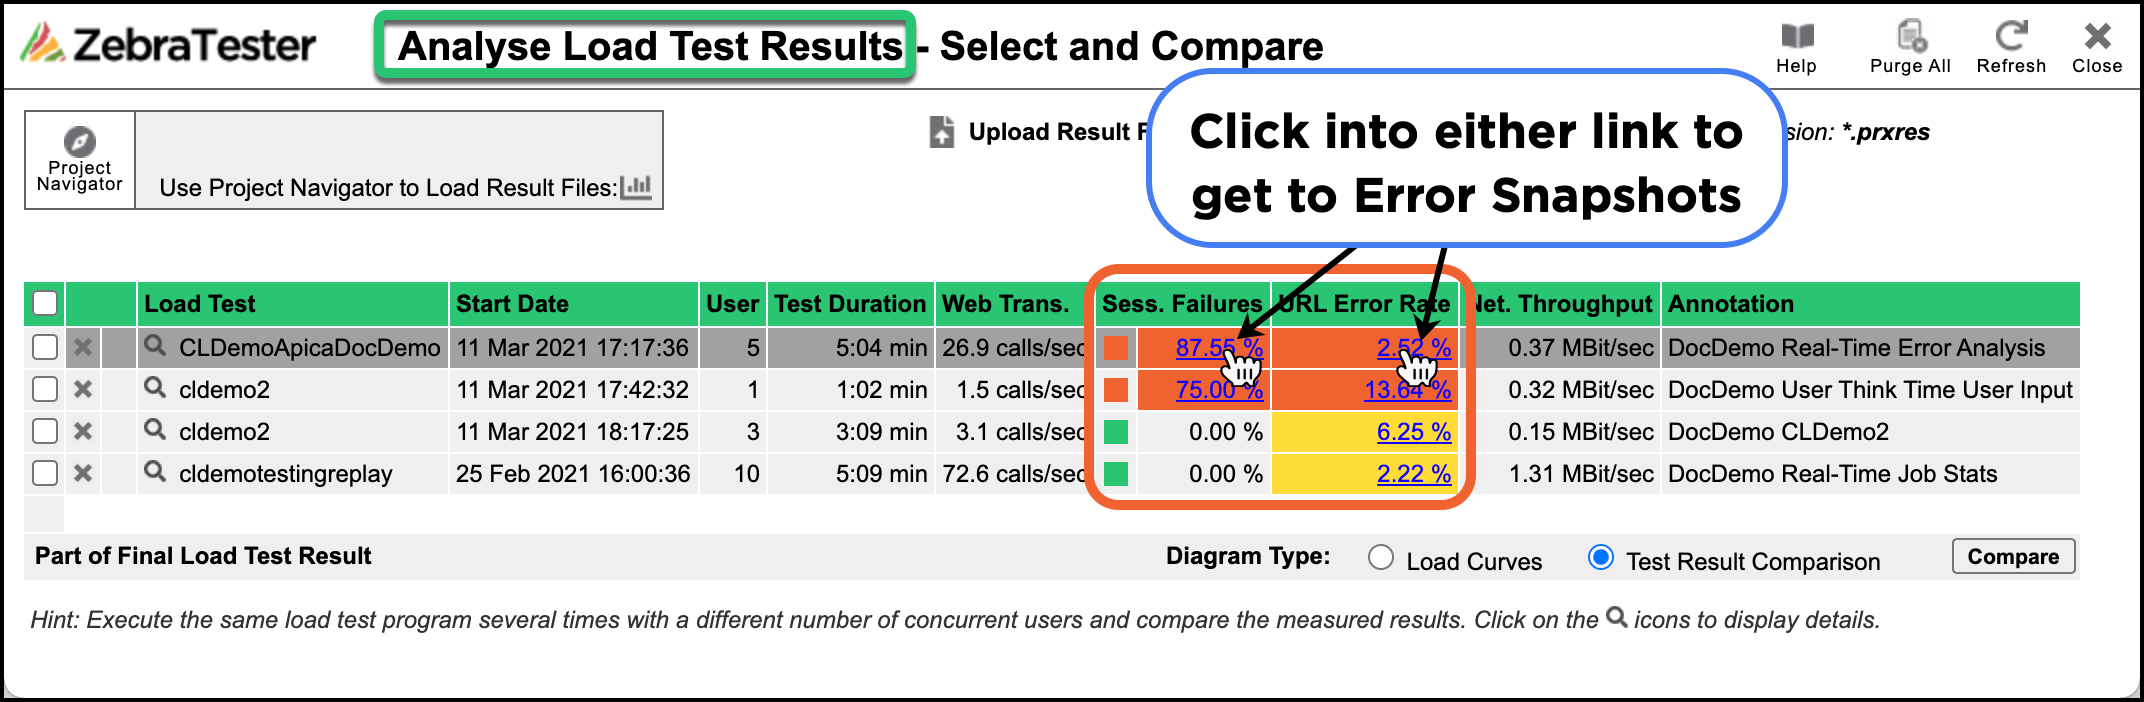
Using PRXRES Files | |
In Project Navigator load a .prxres (ZT load test results) file and clicking into the Session Failures or URL Error Rate links: | |

 |
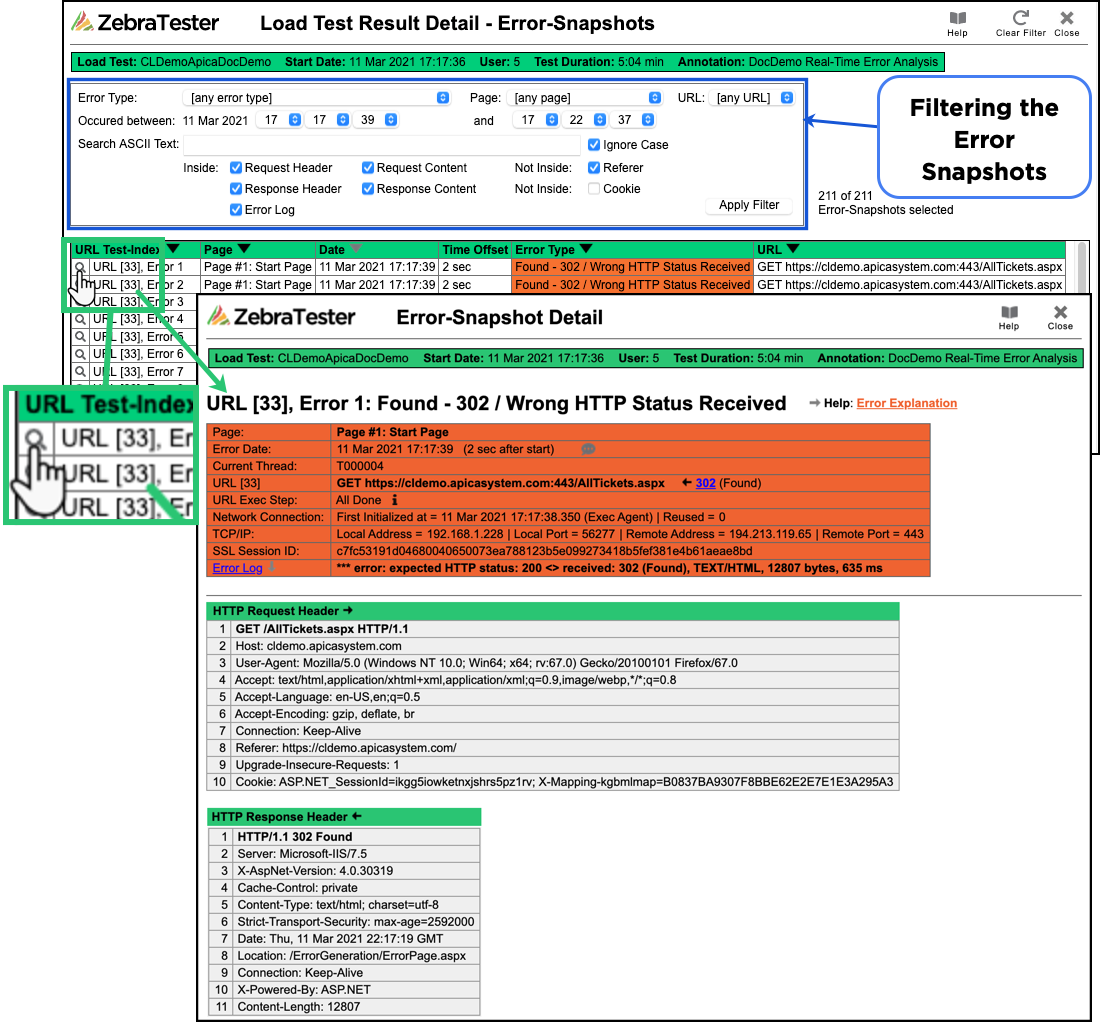
Click into any single row for specific detail on just that error: |
 | |
During a Load Test Run | |
During a load test run where this errors are displayed in Real-Time. The example of Error Snapshots (taken during a Load Test), these sections are combined into a single window. | The upper part of the window contains a list of all error snapshots. This list's content depends on the context from which the menu was invoked (error snapshots of the entire test run, per web page, or per URL). The list can be sorted by URL index or by error time. Clicking on a magnifier icon displays the corresponding error snapshot's detailed data in the lower part of the window. |

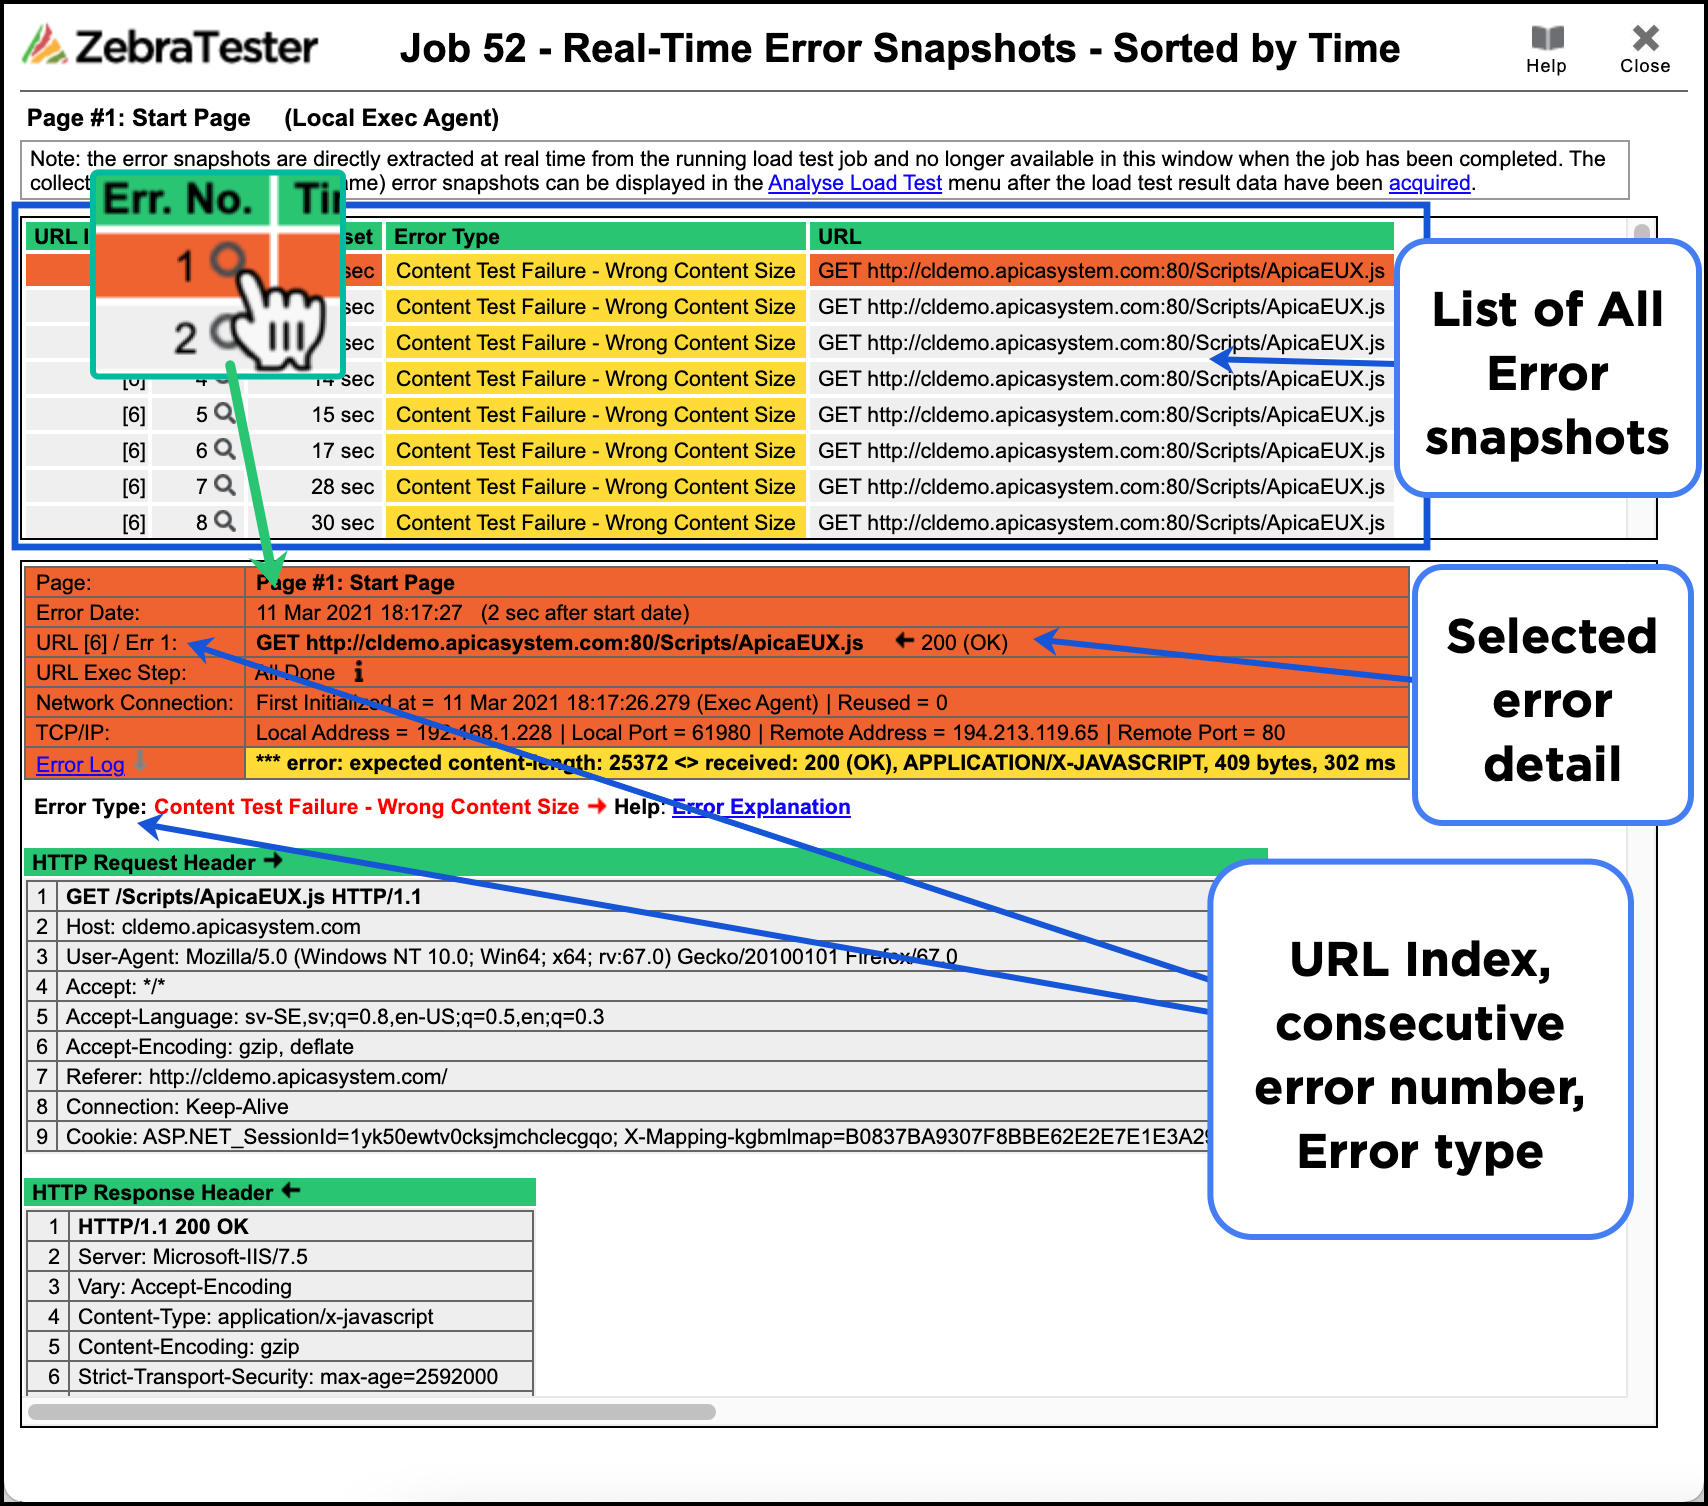 The title in the lower part of the window contains the URL index, a consecutive error number relative to the URL, and a summary description of the error. Clicking on the Error Explanation displays a hint about why the error occurred. |