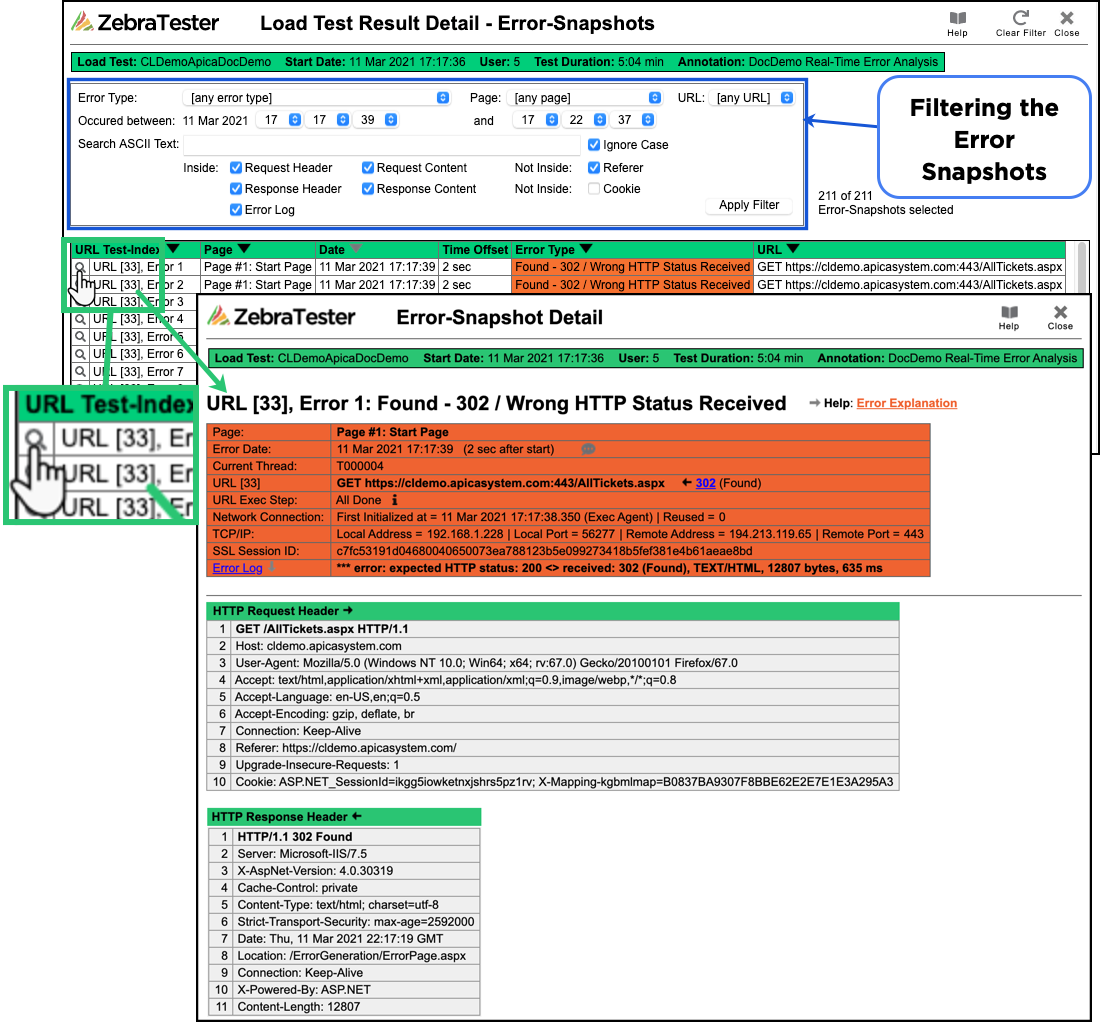
If errors occurred during a load test, a "frozen" snapshot of the entire "error-situation" is taken for each error - as long as the number of maximum allowed error snapshots not exceeded.
The maximum number of allowed error snapshots is set when the test run is started (test input parameter: Max. Error-Snapshots).
An error snapshot contains the following data:
The date and time the error occurred.
The defective URL, including a reference to the web page.
The error type and the HTTP status code.
The internal execution step of the failed URL call, at the point in time when the error has occurred; for example, "open network connection" or "receive content."
All data about the failed URL call: HTTP request header, HTTP request content (only if transmitted), HTTP response header (only if received), HTTP response content (only if received).
The Error Log: The session log of the simulated user. This includes also actual information about the values of variables that have been defined by using the Var Handler.
A Thread Statistic at Error Time: a "system snapshot" of the activity of all (other) concurrent users.
What follows are two ways to get to the Error Snapshots.
Using PRXRES Files |
In Project Navigator load a .prxres (ZT load test results) file and clicking into the Session Failures or URL Error Rate links: |  |
Click into any single row for specific detail on just that error: |  |
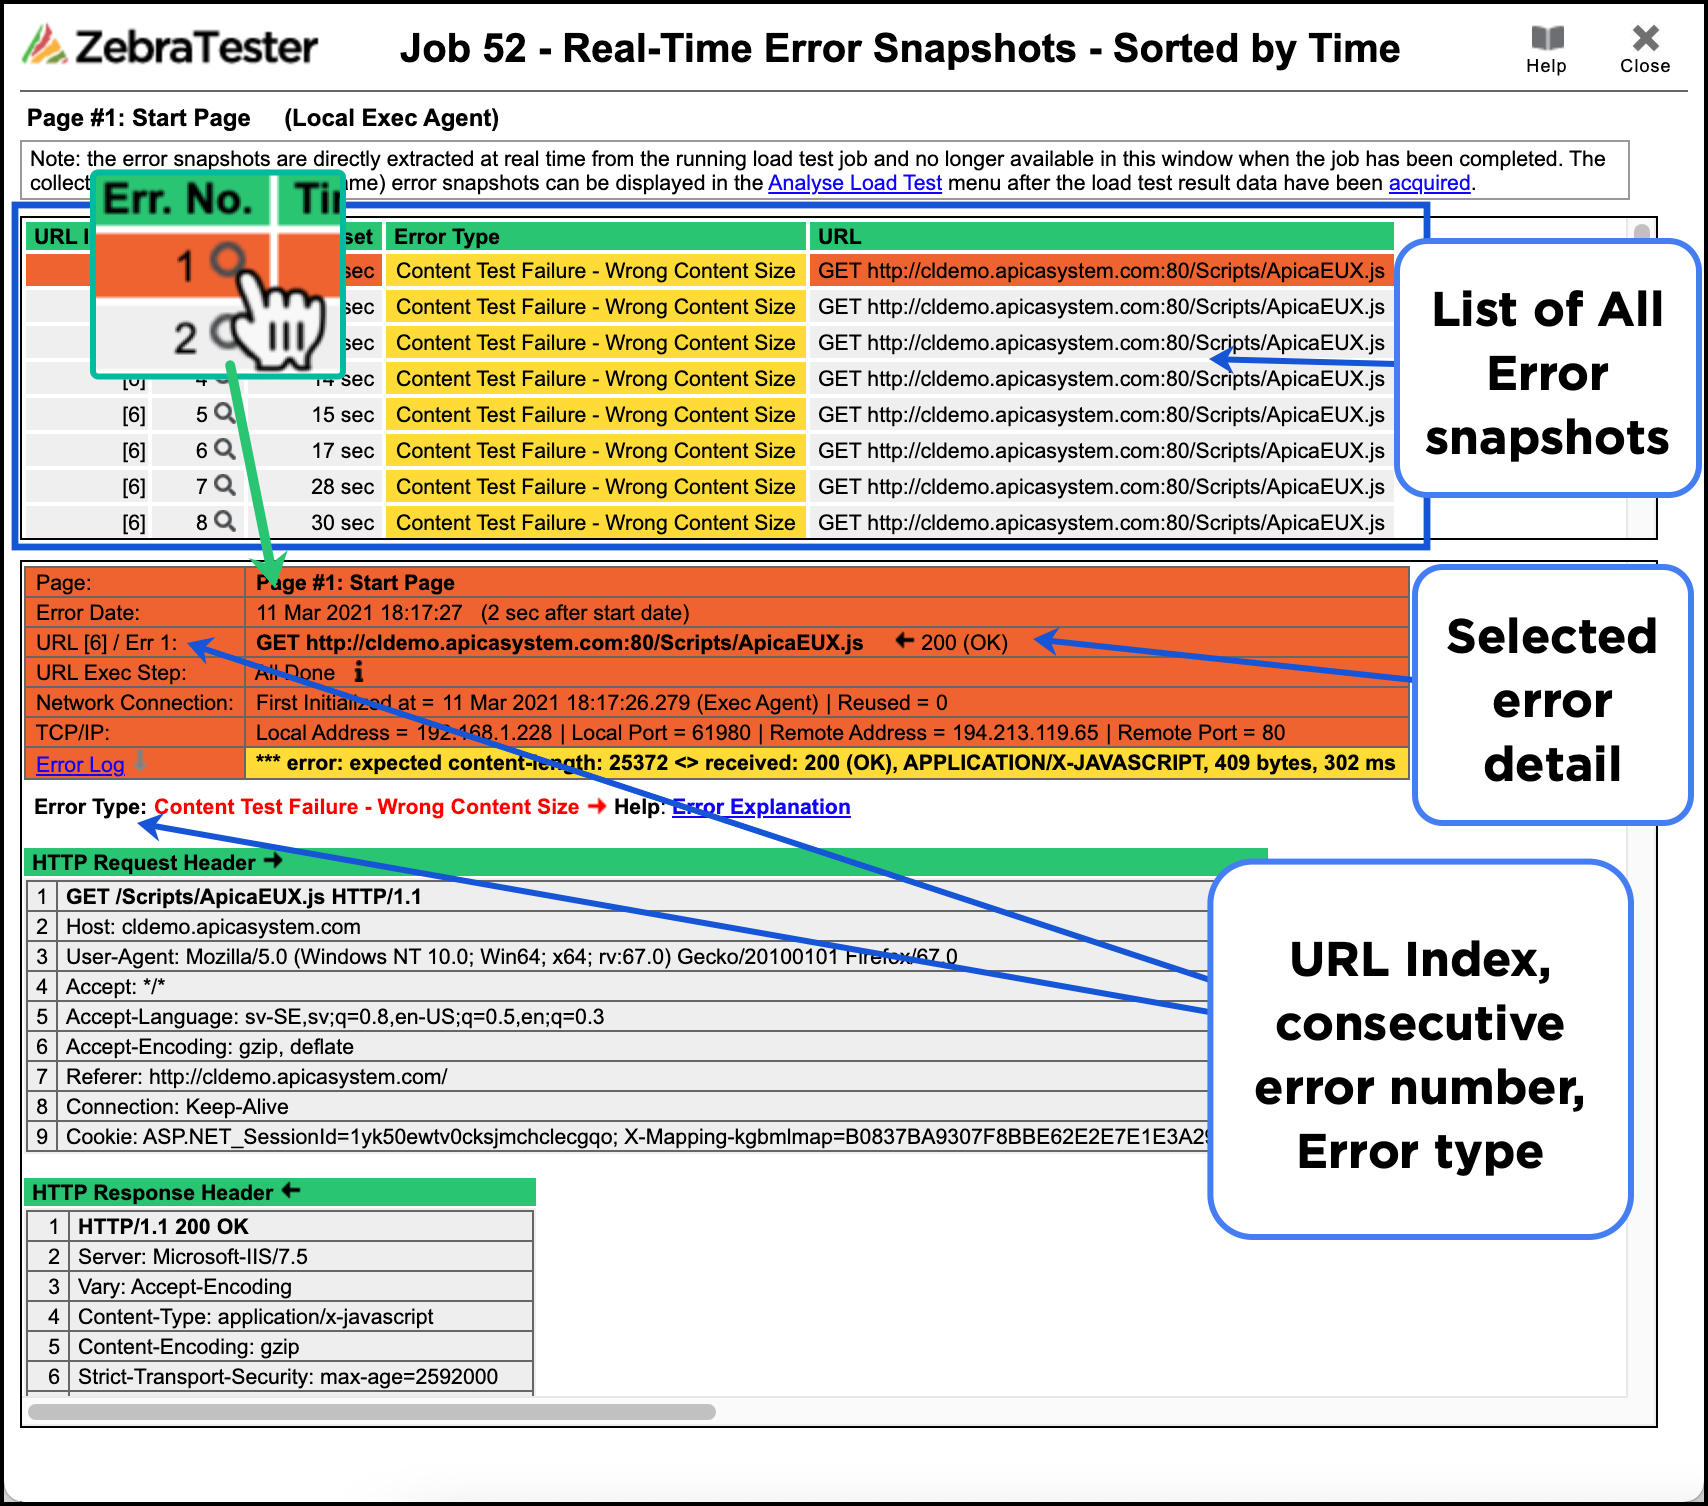
During a Load Test Run |
During a load test run where this errors are displayed in Real-Time. The example of Error Snapshots (taken during a Load Test), these sections are combined into a single window. | The upper part of the window contains a list of all error snapshots. This list's content depends on the context from which the menu was invoked (error snapshots of the entire test run, per web page, or per URL). The list can be sorted by URL index or by error time. Clicking on a magnifier icon displays the corresponding error snapshot's detailed data in the lower part of the window.  The title in the lower part of the window contains the URL index, a consecutive error number relative to the URL, and a summary description of the error. Clicking on the Error Explanation displays a hint about why the error occurred. |


