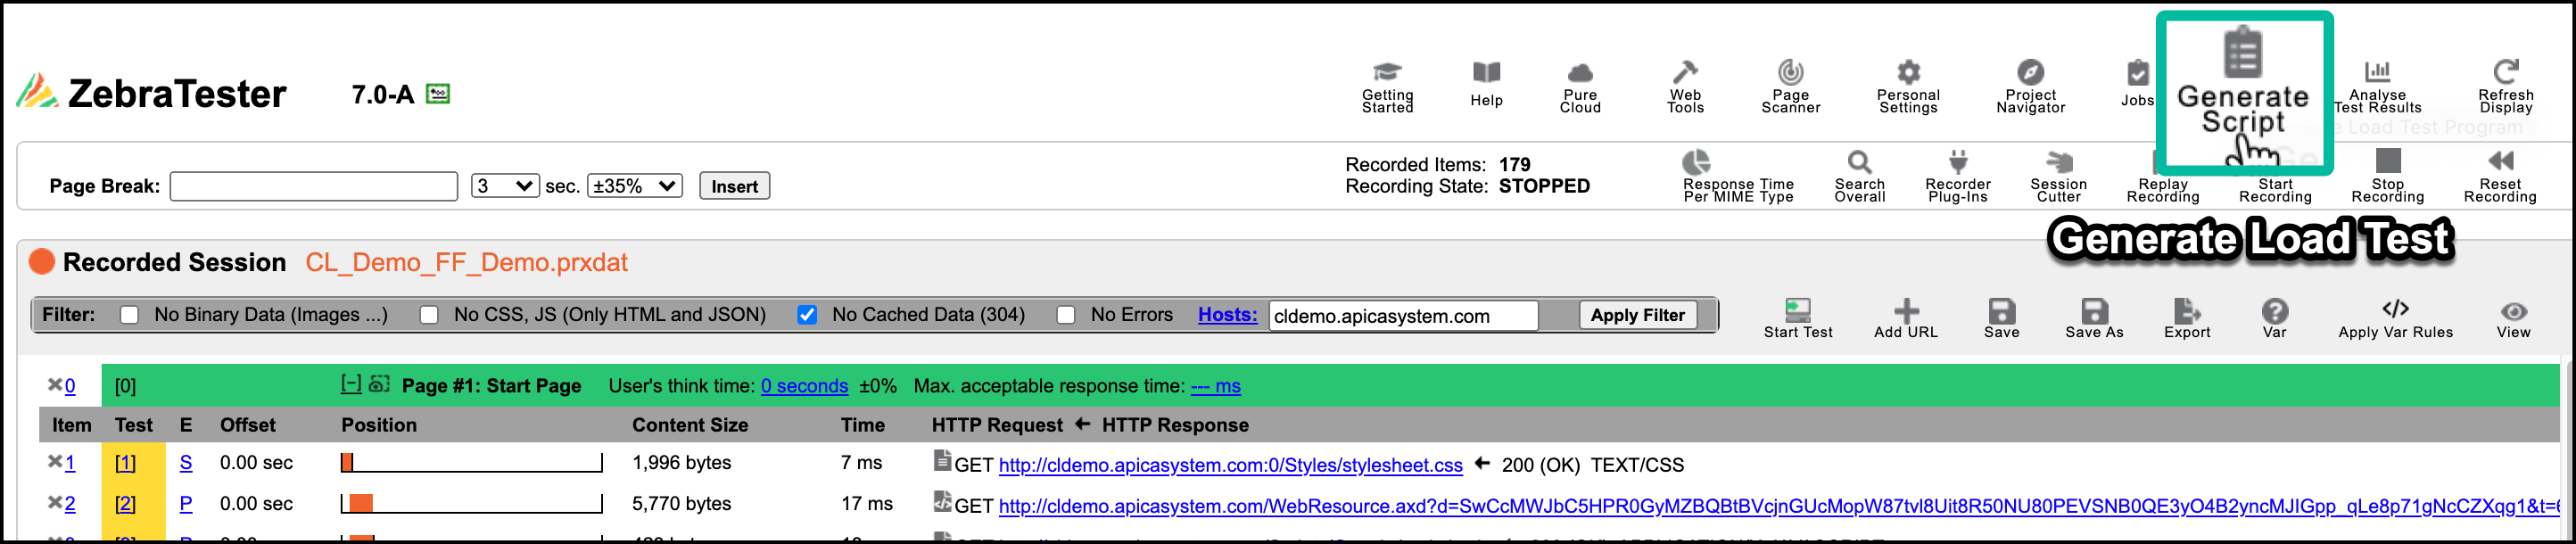
You can now execute a first try of the load test if your recorded Web surfing session does not contain dynamically exchanged session parameters. What follows is only a short overview.
Step | Screenshot |
|---|---|
Convert the recorded Web surfing session into a load test program
|  |
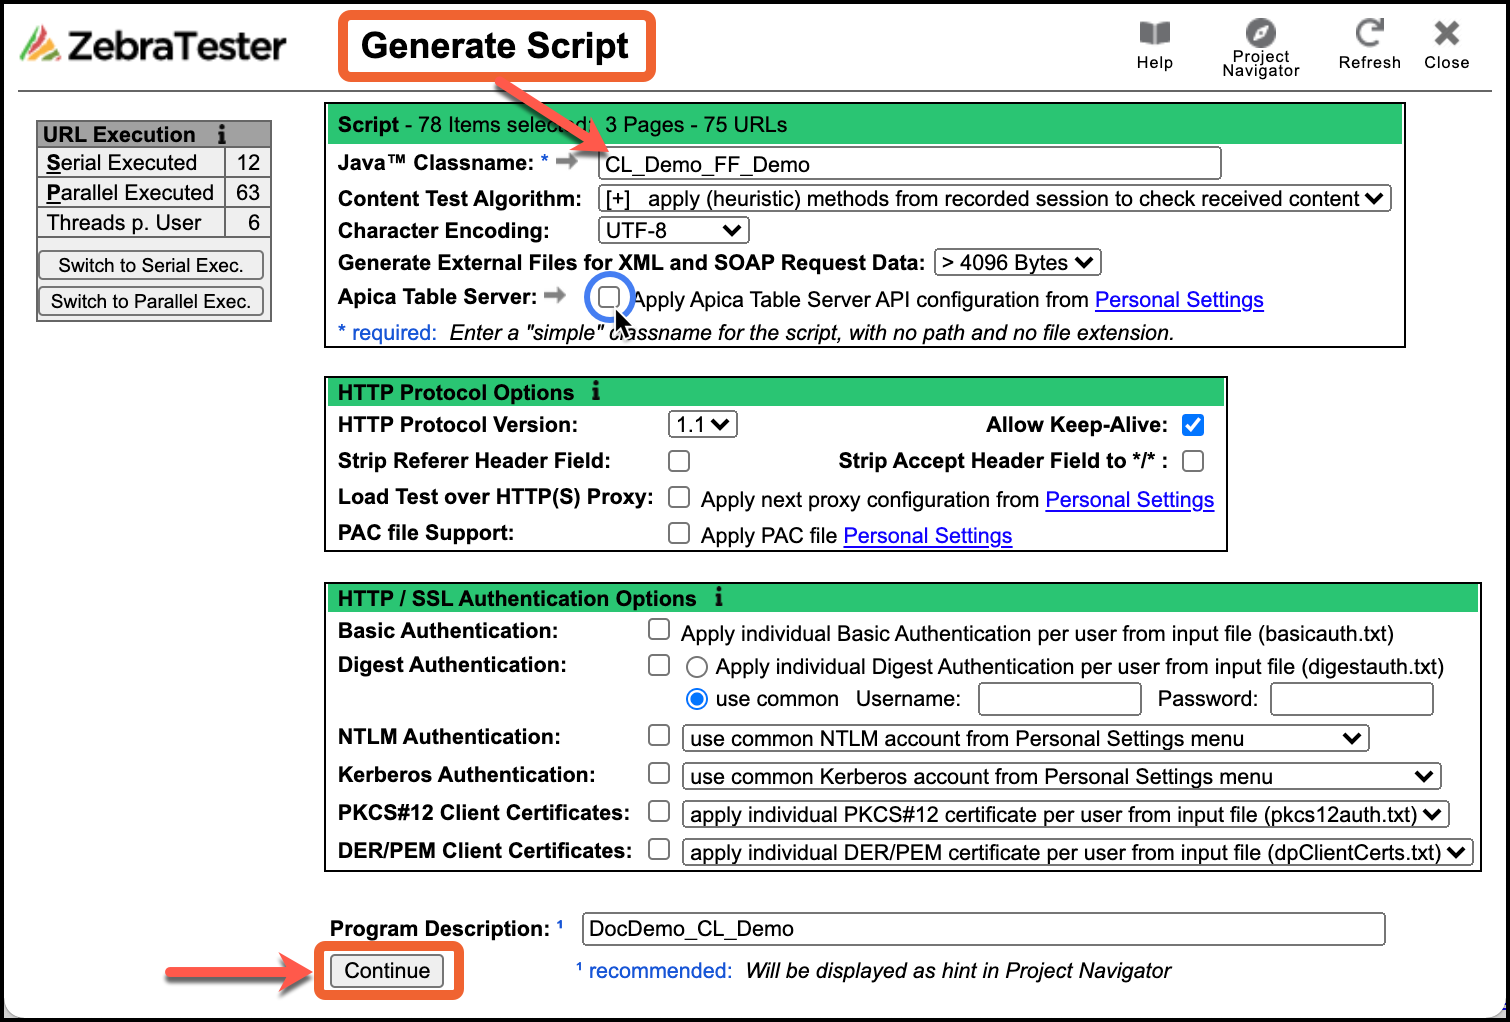
Fill in Script Parameters
|  |
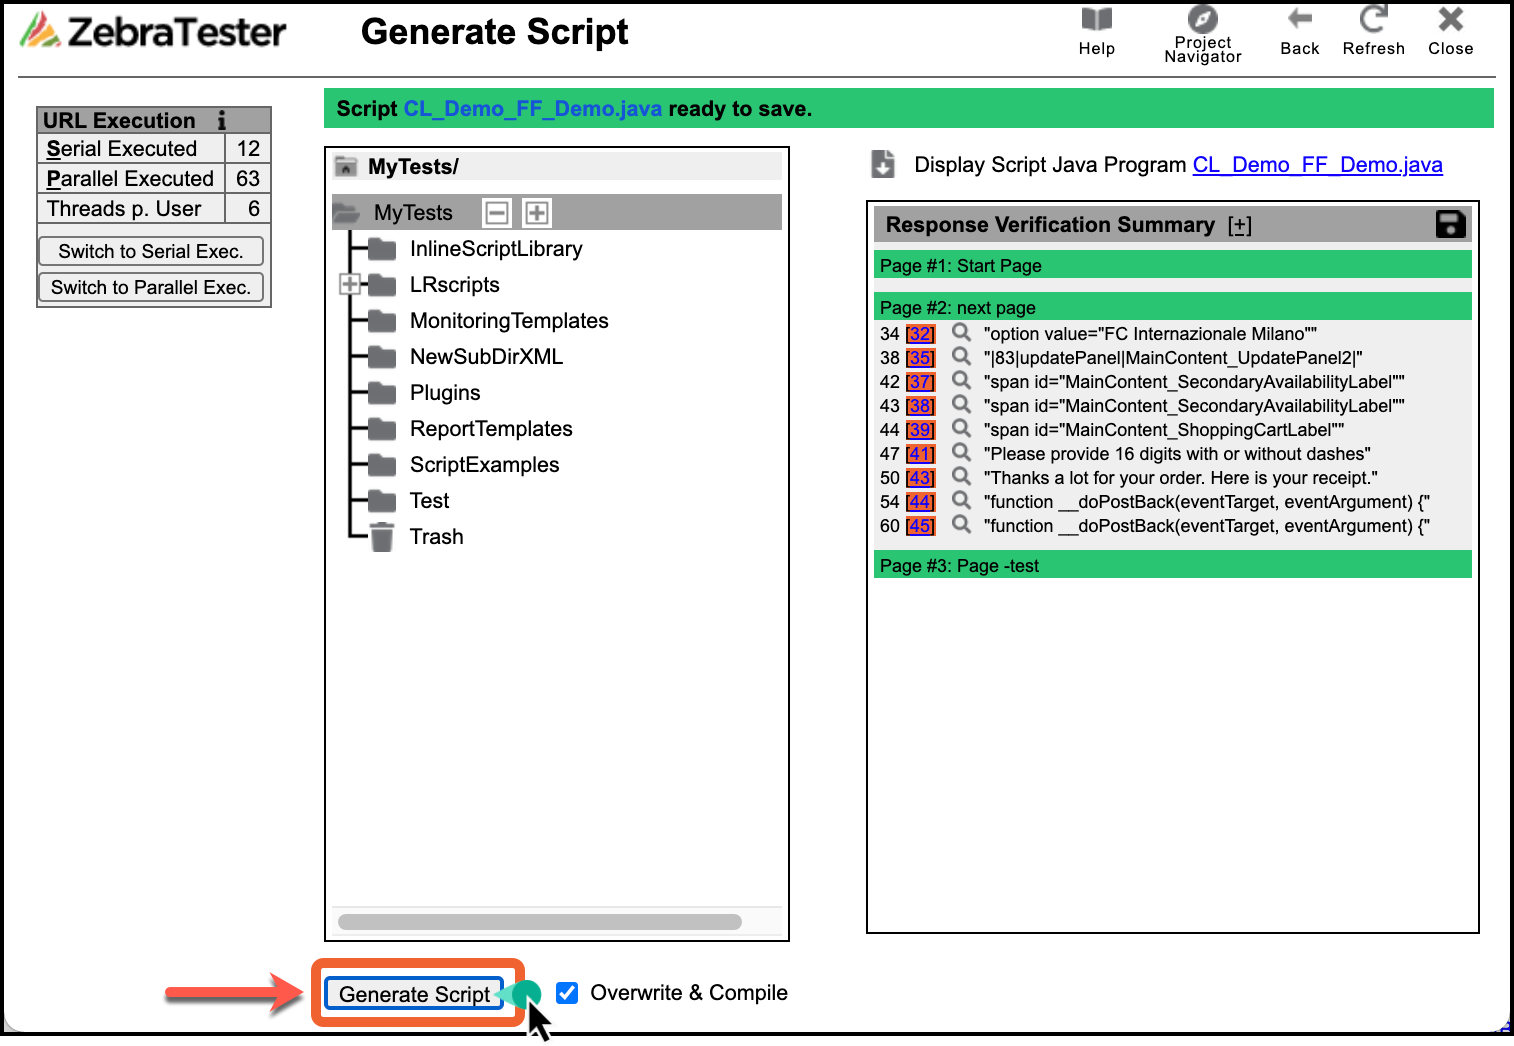
Save/Generate the Script
|  |
Now, the load test program can be started. Apica recommends choosing only a few numbers of simulated users and a short execution time for the first test run | |
Compiled CLASS File Created | |


Note the banner that the class file has been created. There will be an icon to Execute the Load Test to the right of it. | 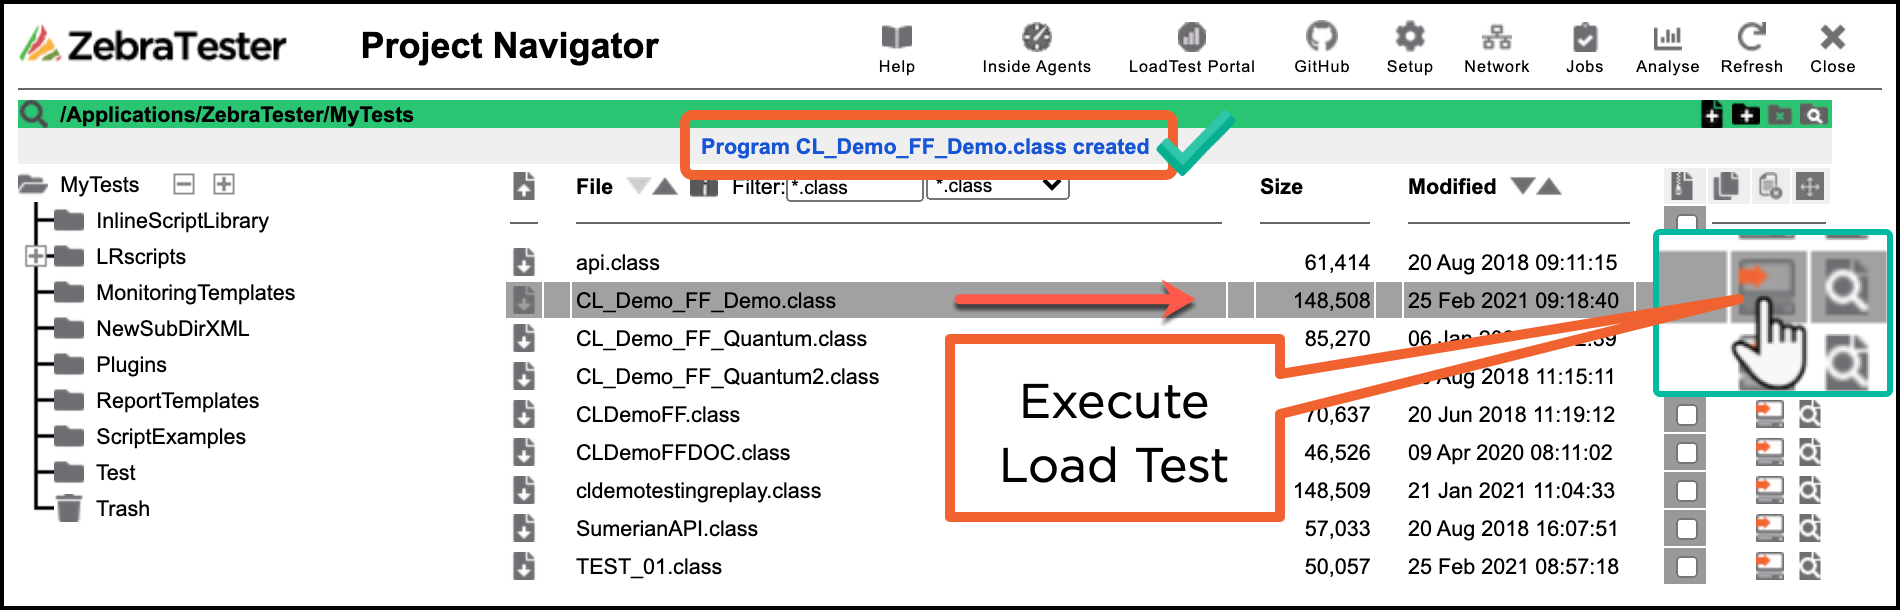 |
Fill in LT ParametersAmong other fields, note the values for LT Duration, and the loop limitations per user and pacing options. Increasing the Sampling Rate to 100% more is recommended for short runs. Additional data can be captured. Set Browser Emulation desired and any Caching Options. | 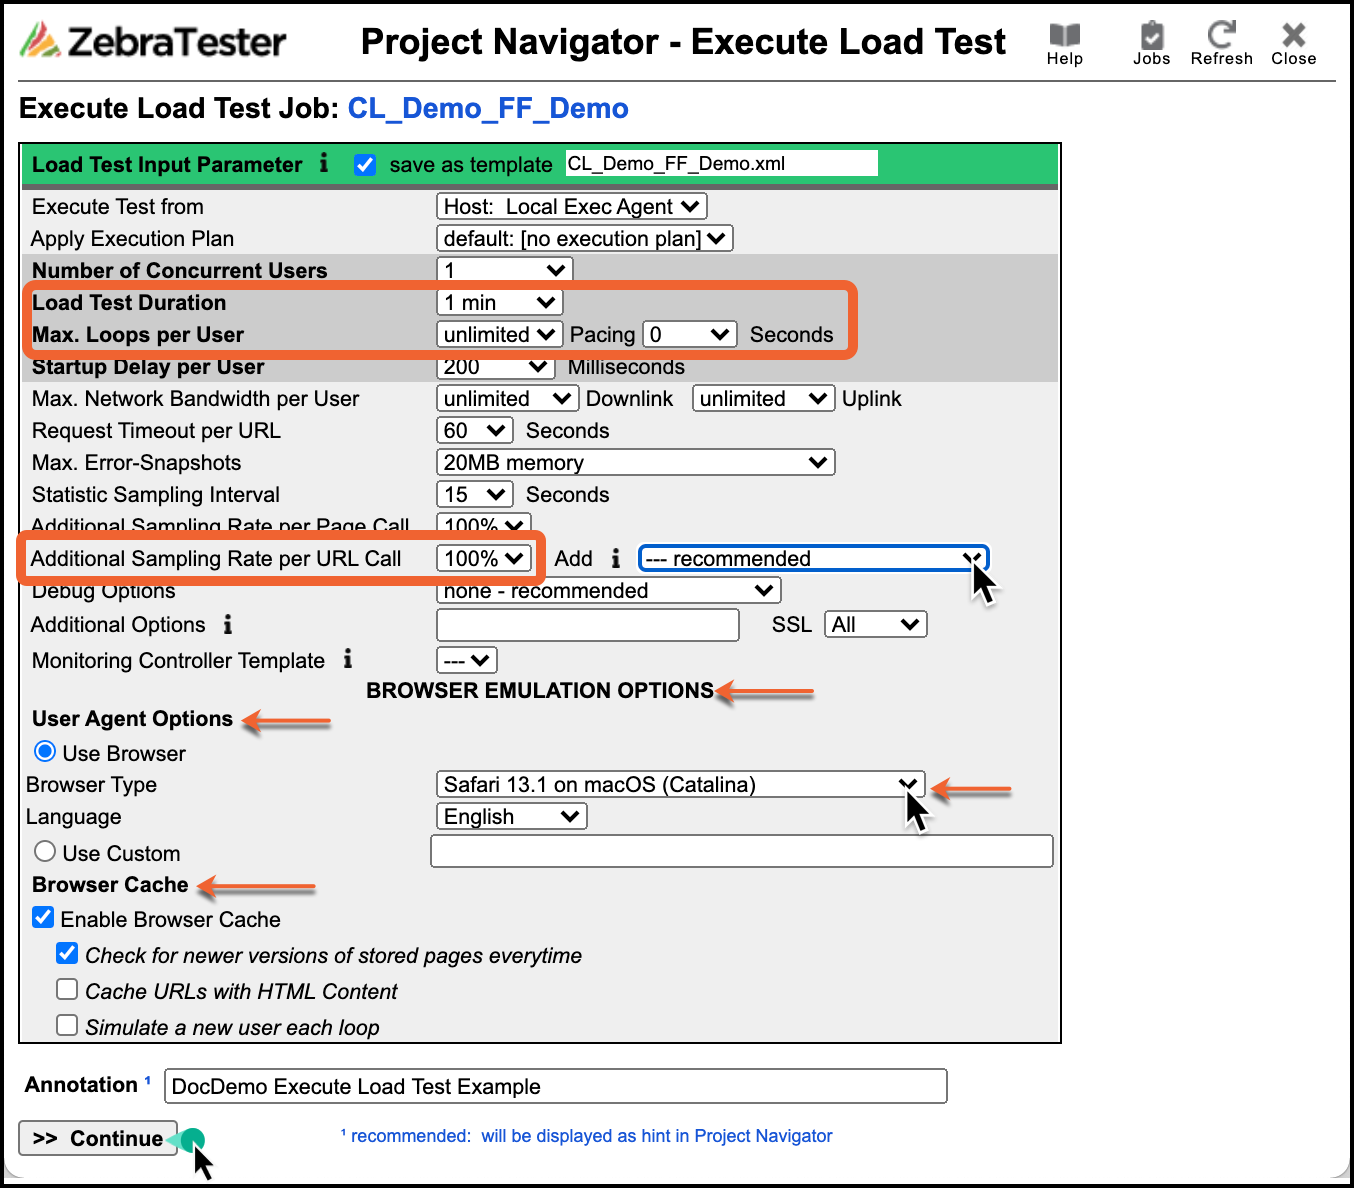 Press Continue to go to the final Confirmation page |
Start the Load Test JobThis dialog summarizes all the LT selections and allows starting it immediately or schedulting for later. |  |
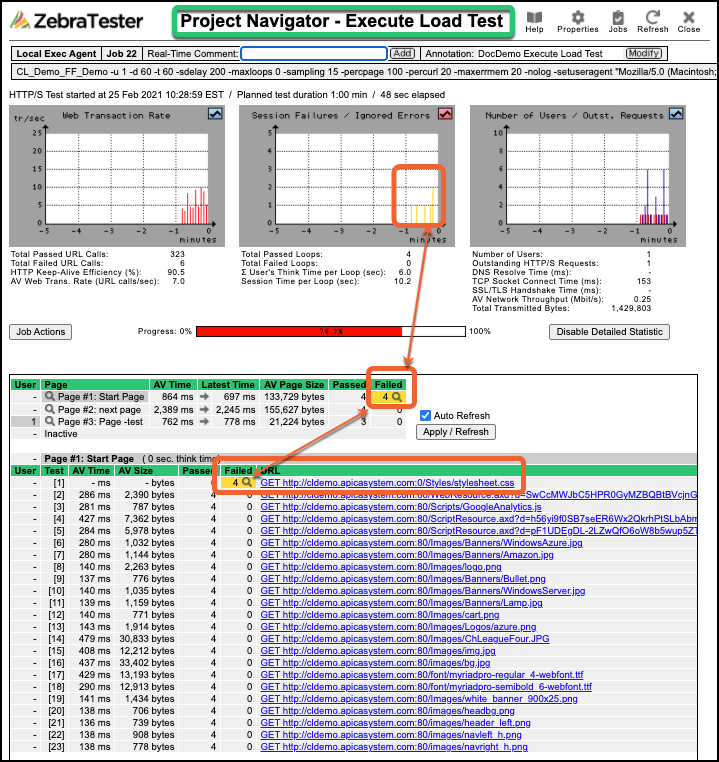
Running Load TestThis screen is an LT in progress and has the Detailed Statistics enabled while executing. You can Disable this as needed. | 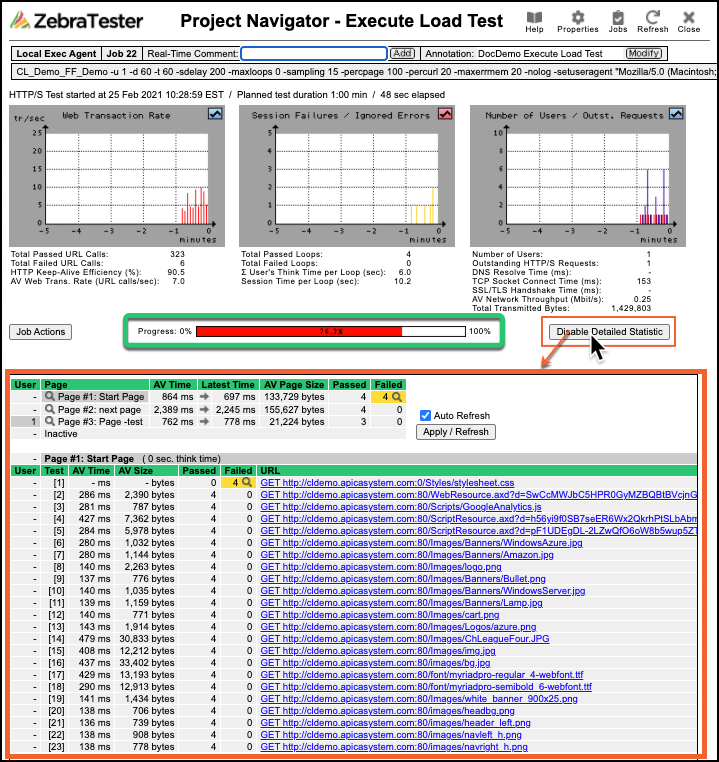 |
Test EndedThe Job will show completed and there will be a button to Aquire the detailed Test Results. | 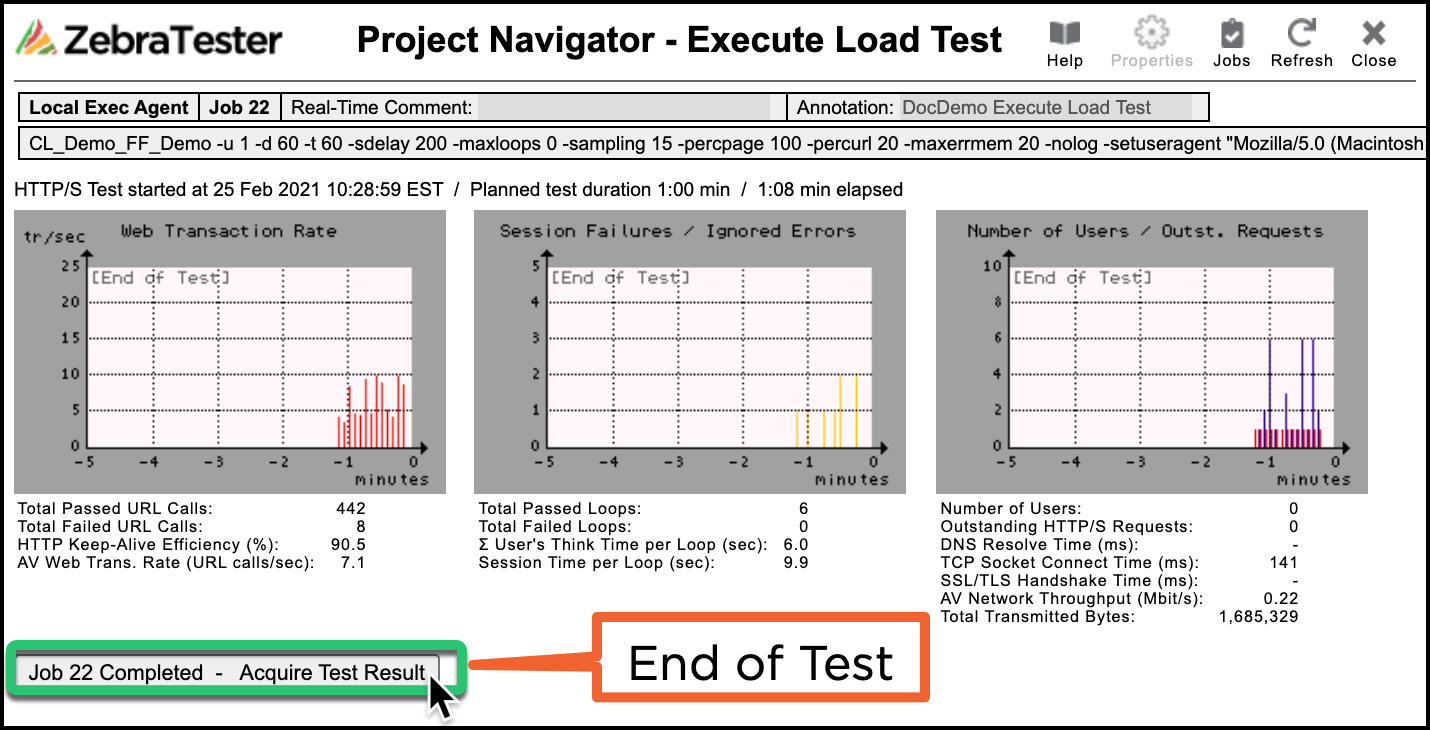 |
Select Results and displayThe results of an LT is a PRXRES file format. Select it and note that the options to load it into the Analysis Menu and close the window. | 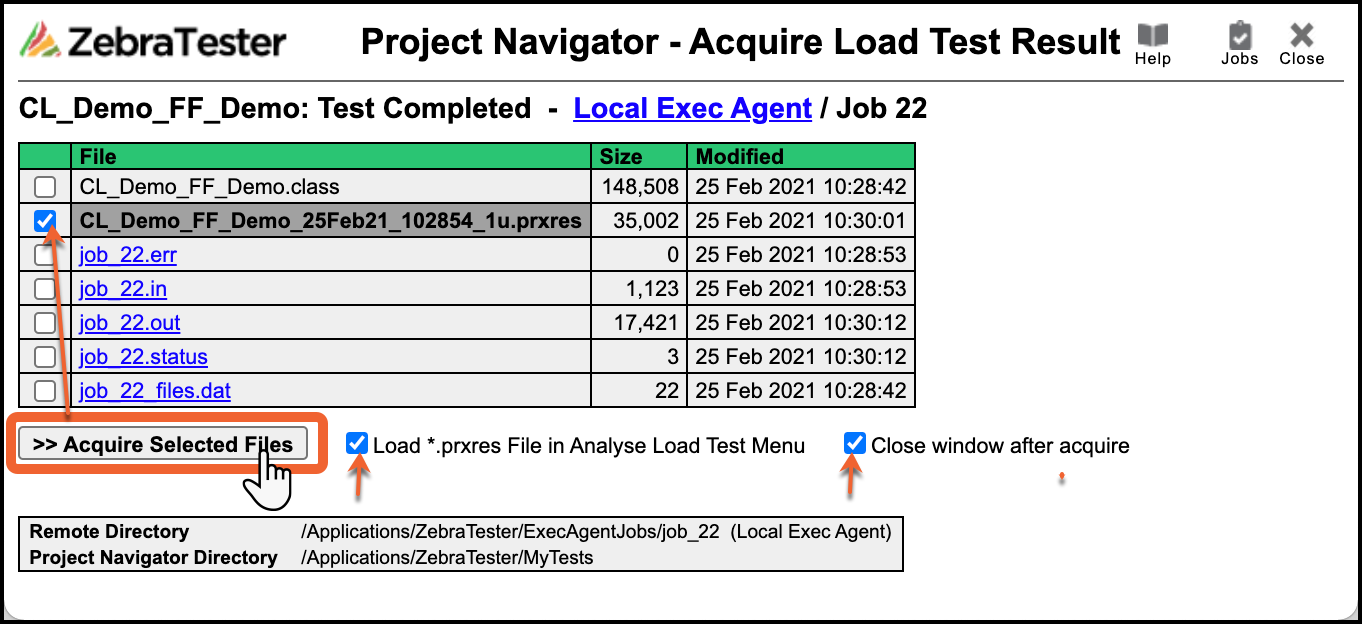 |
Click Into the ResultsThis screen has other options to compare with other LTs, but here we want to see the results of what we just ran. | 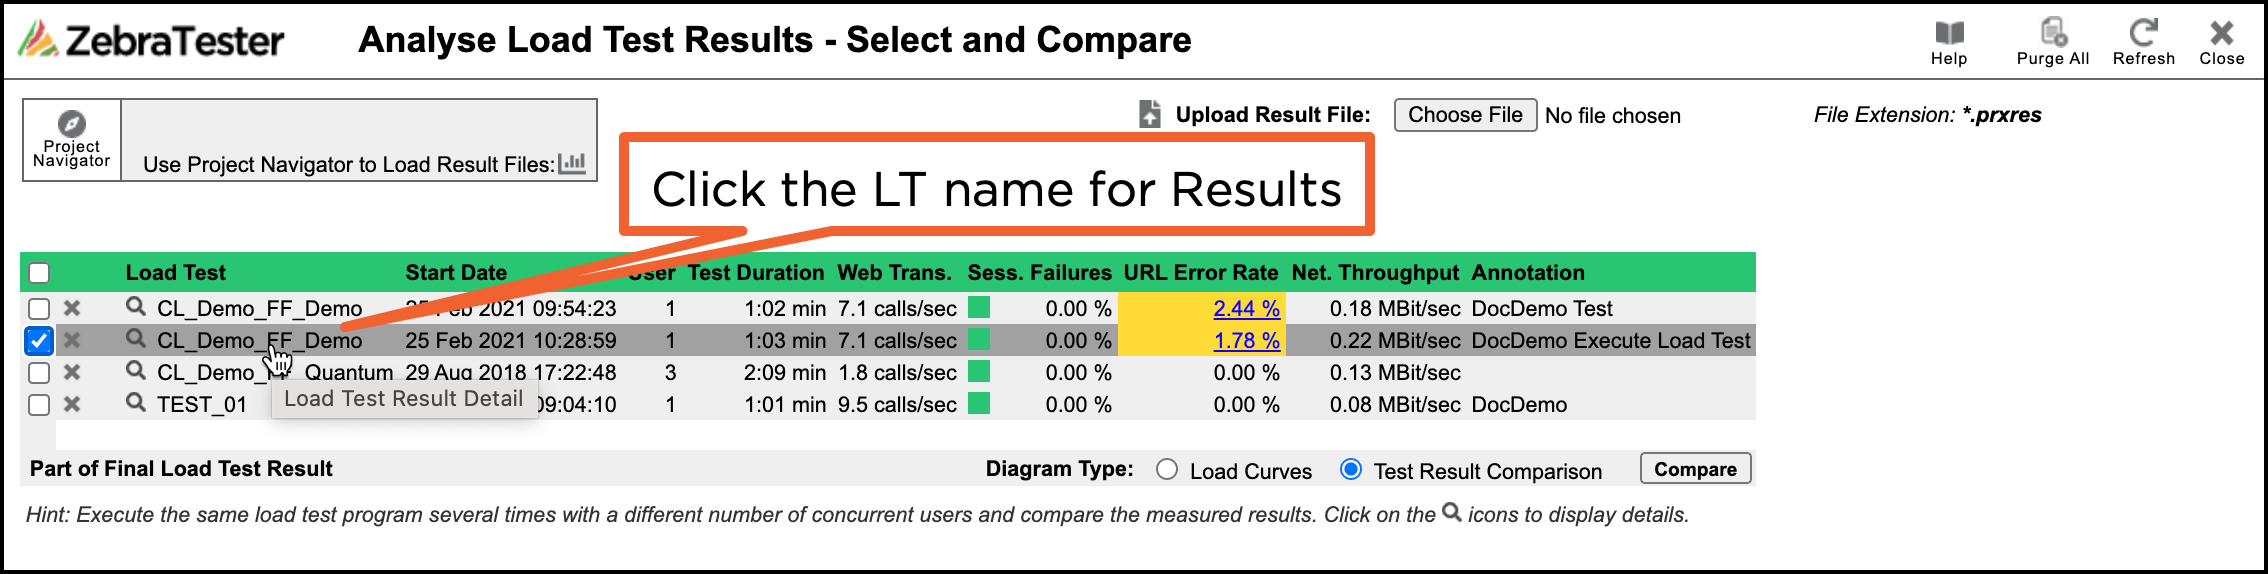 |
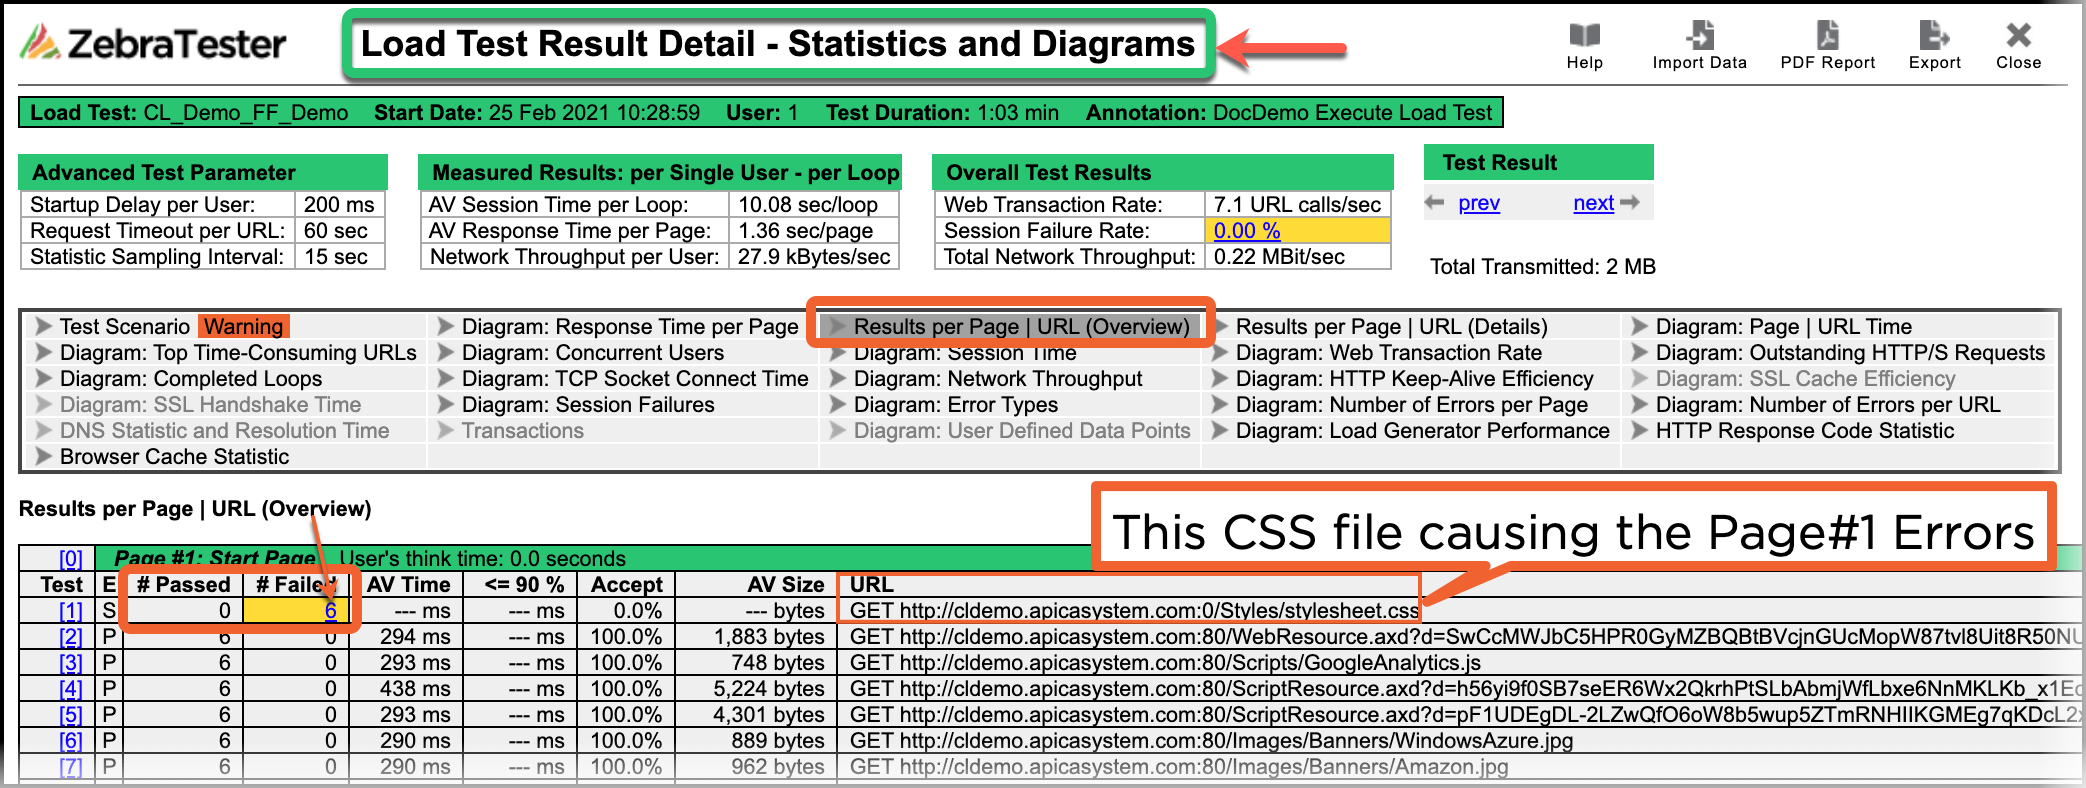
Statistics and Diagrams-1This page is actually a summary in green at the top as well as a selection grid of what data results to see. Here, The Results per Page/URL is displayed. | 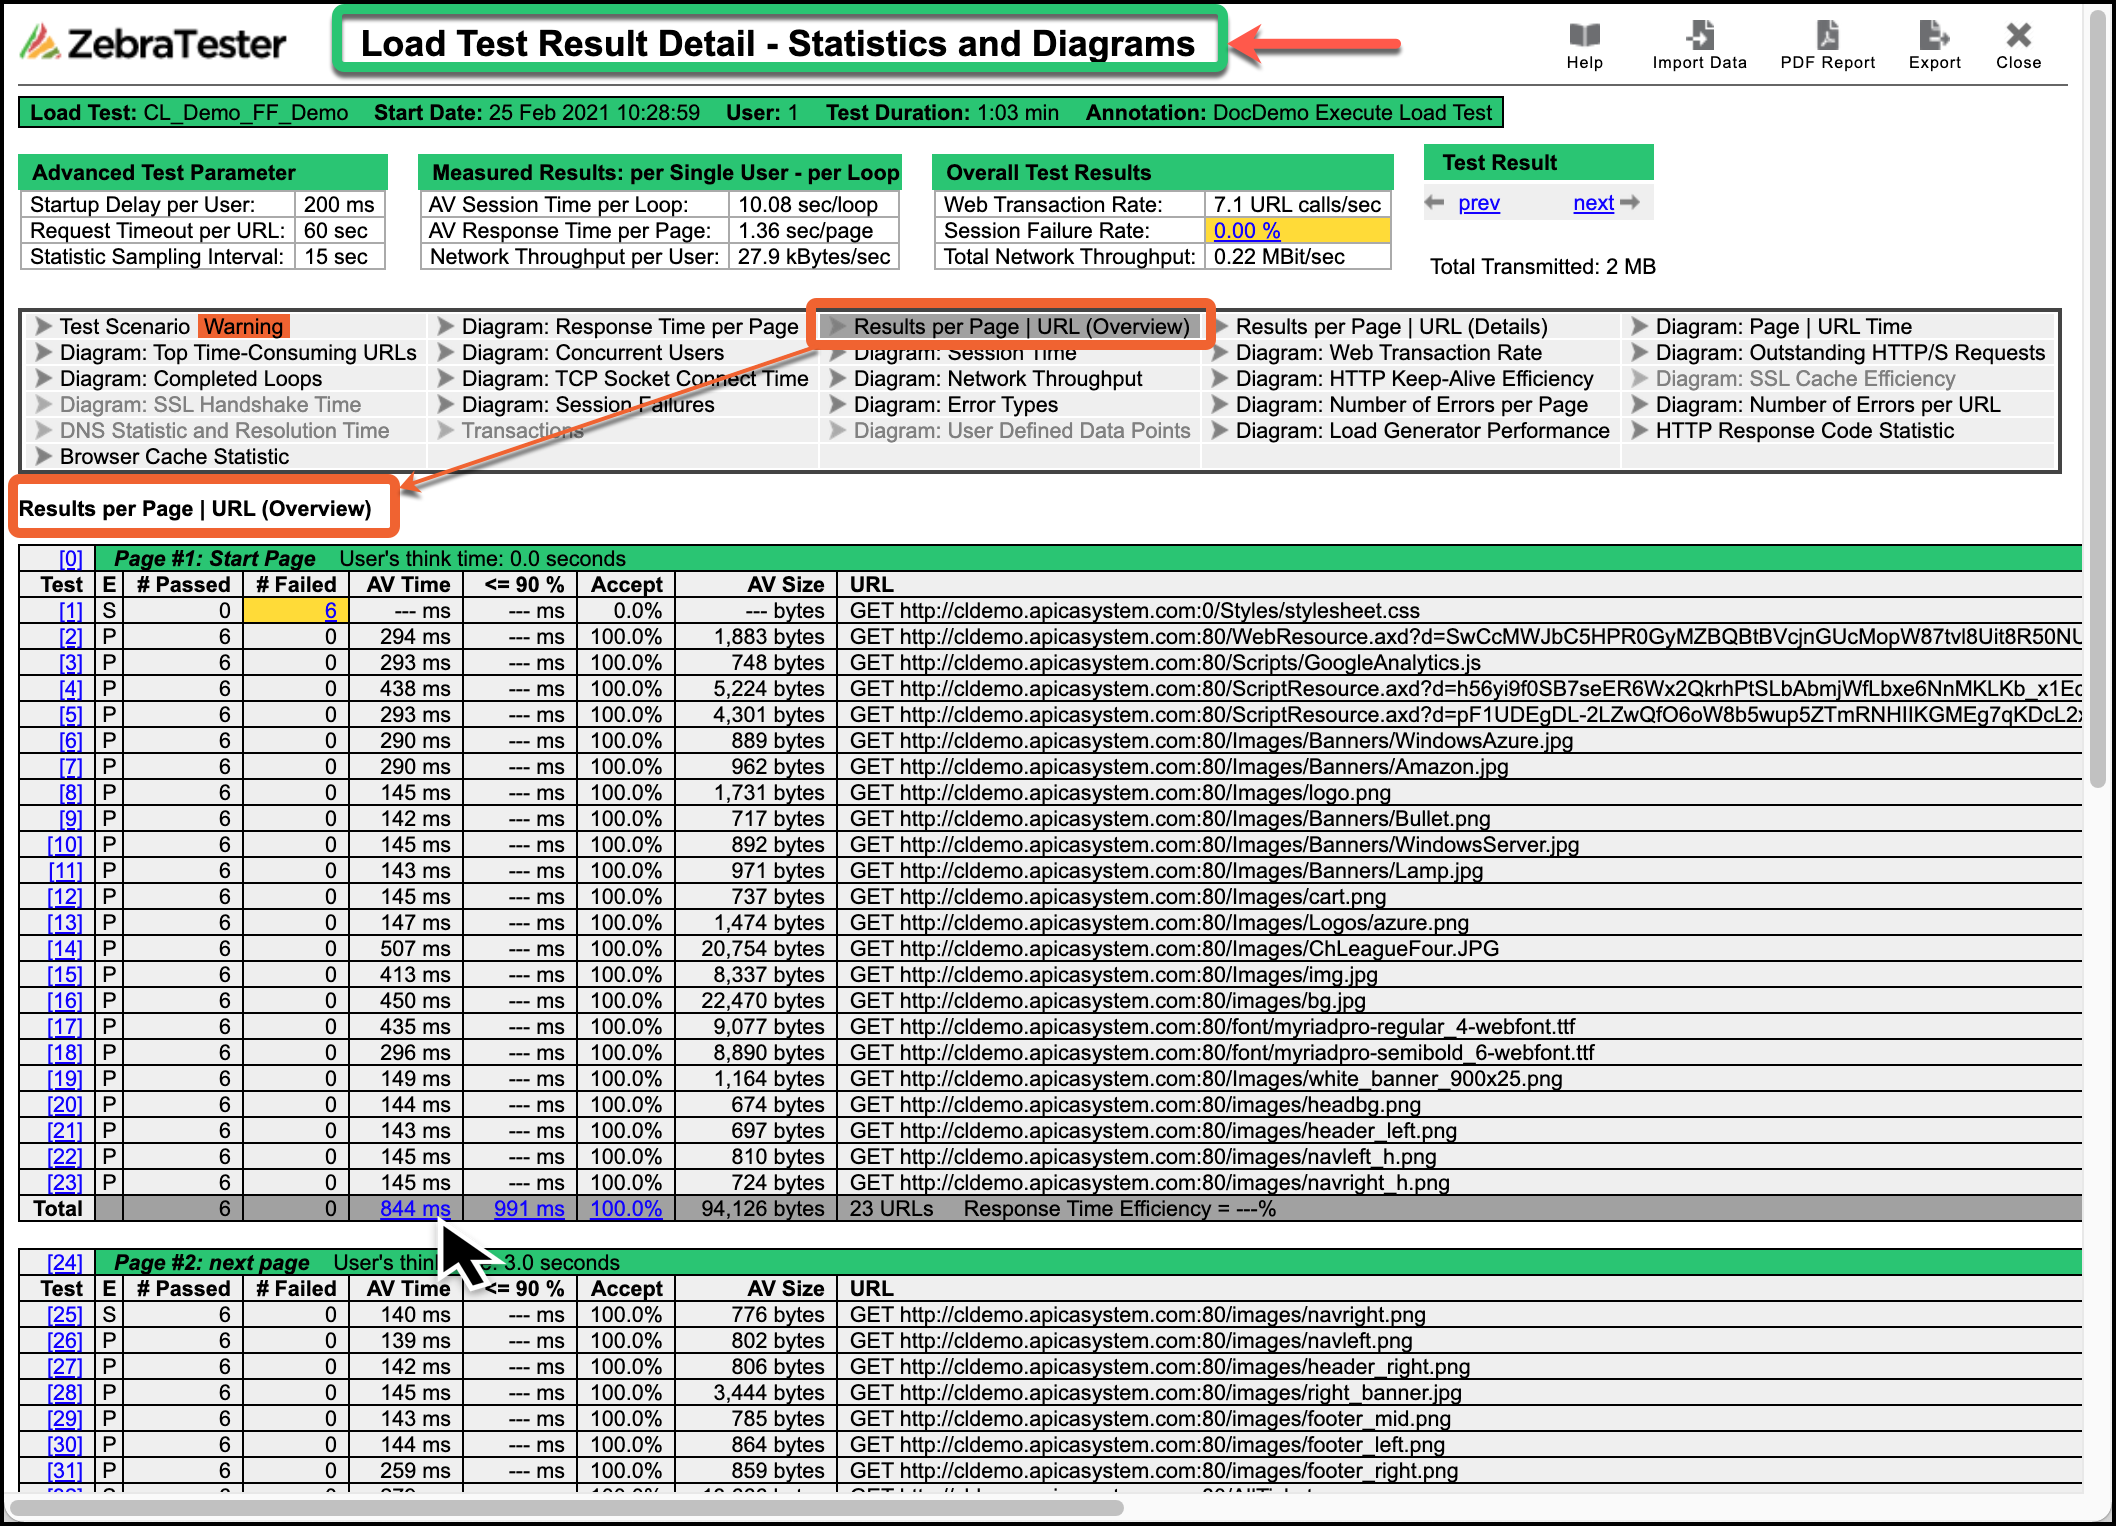 |
Statistics and Diagrams-2This is one of the Response Time diagram pages for each Page.
| 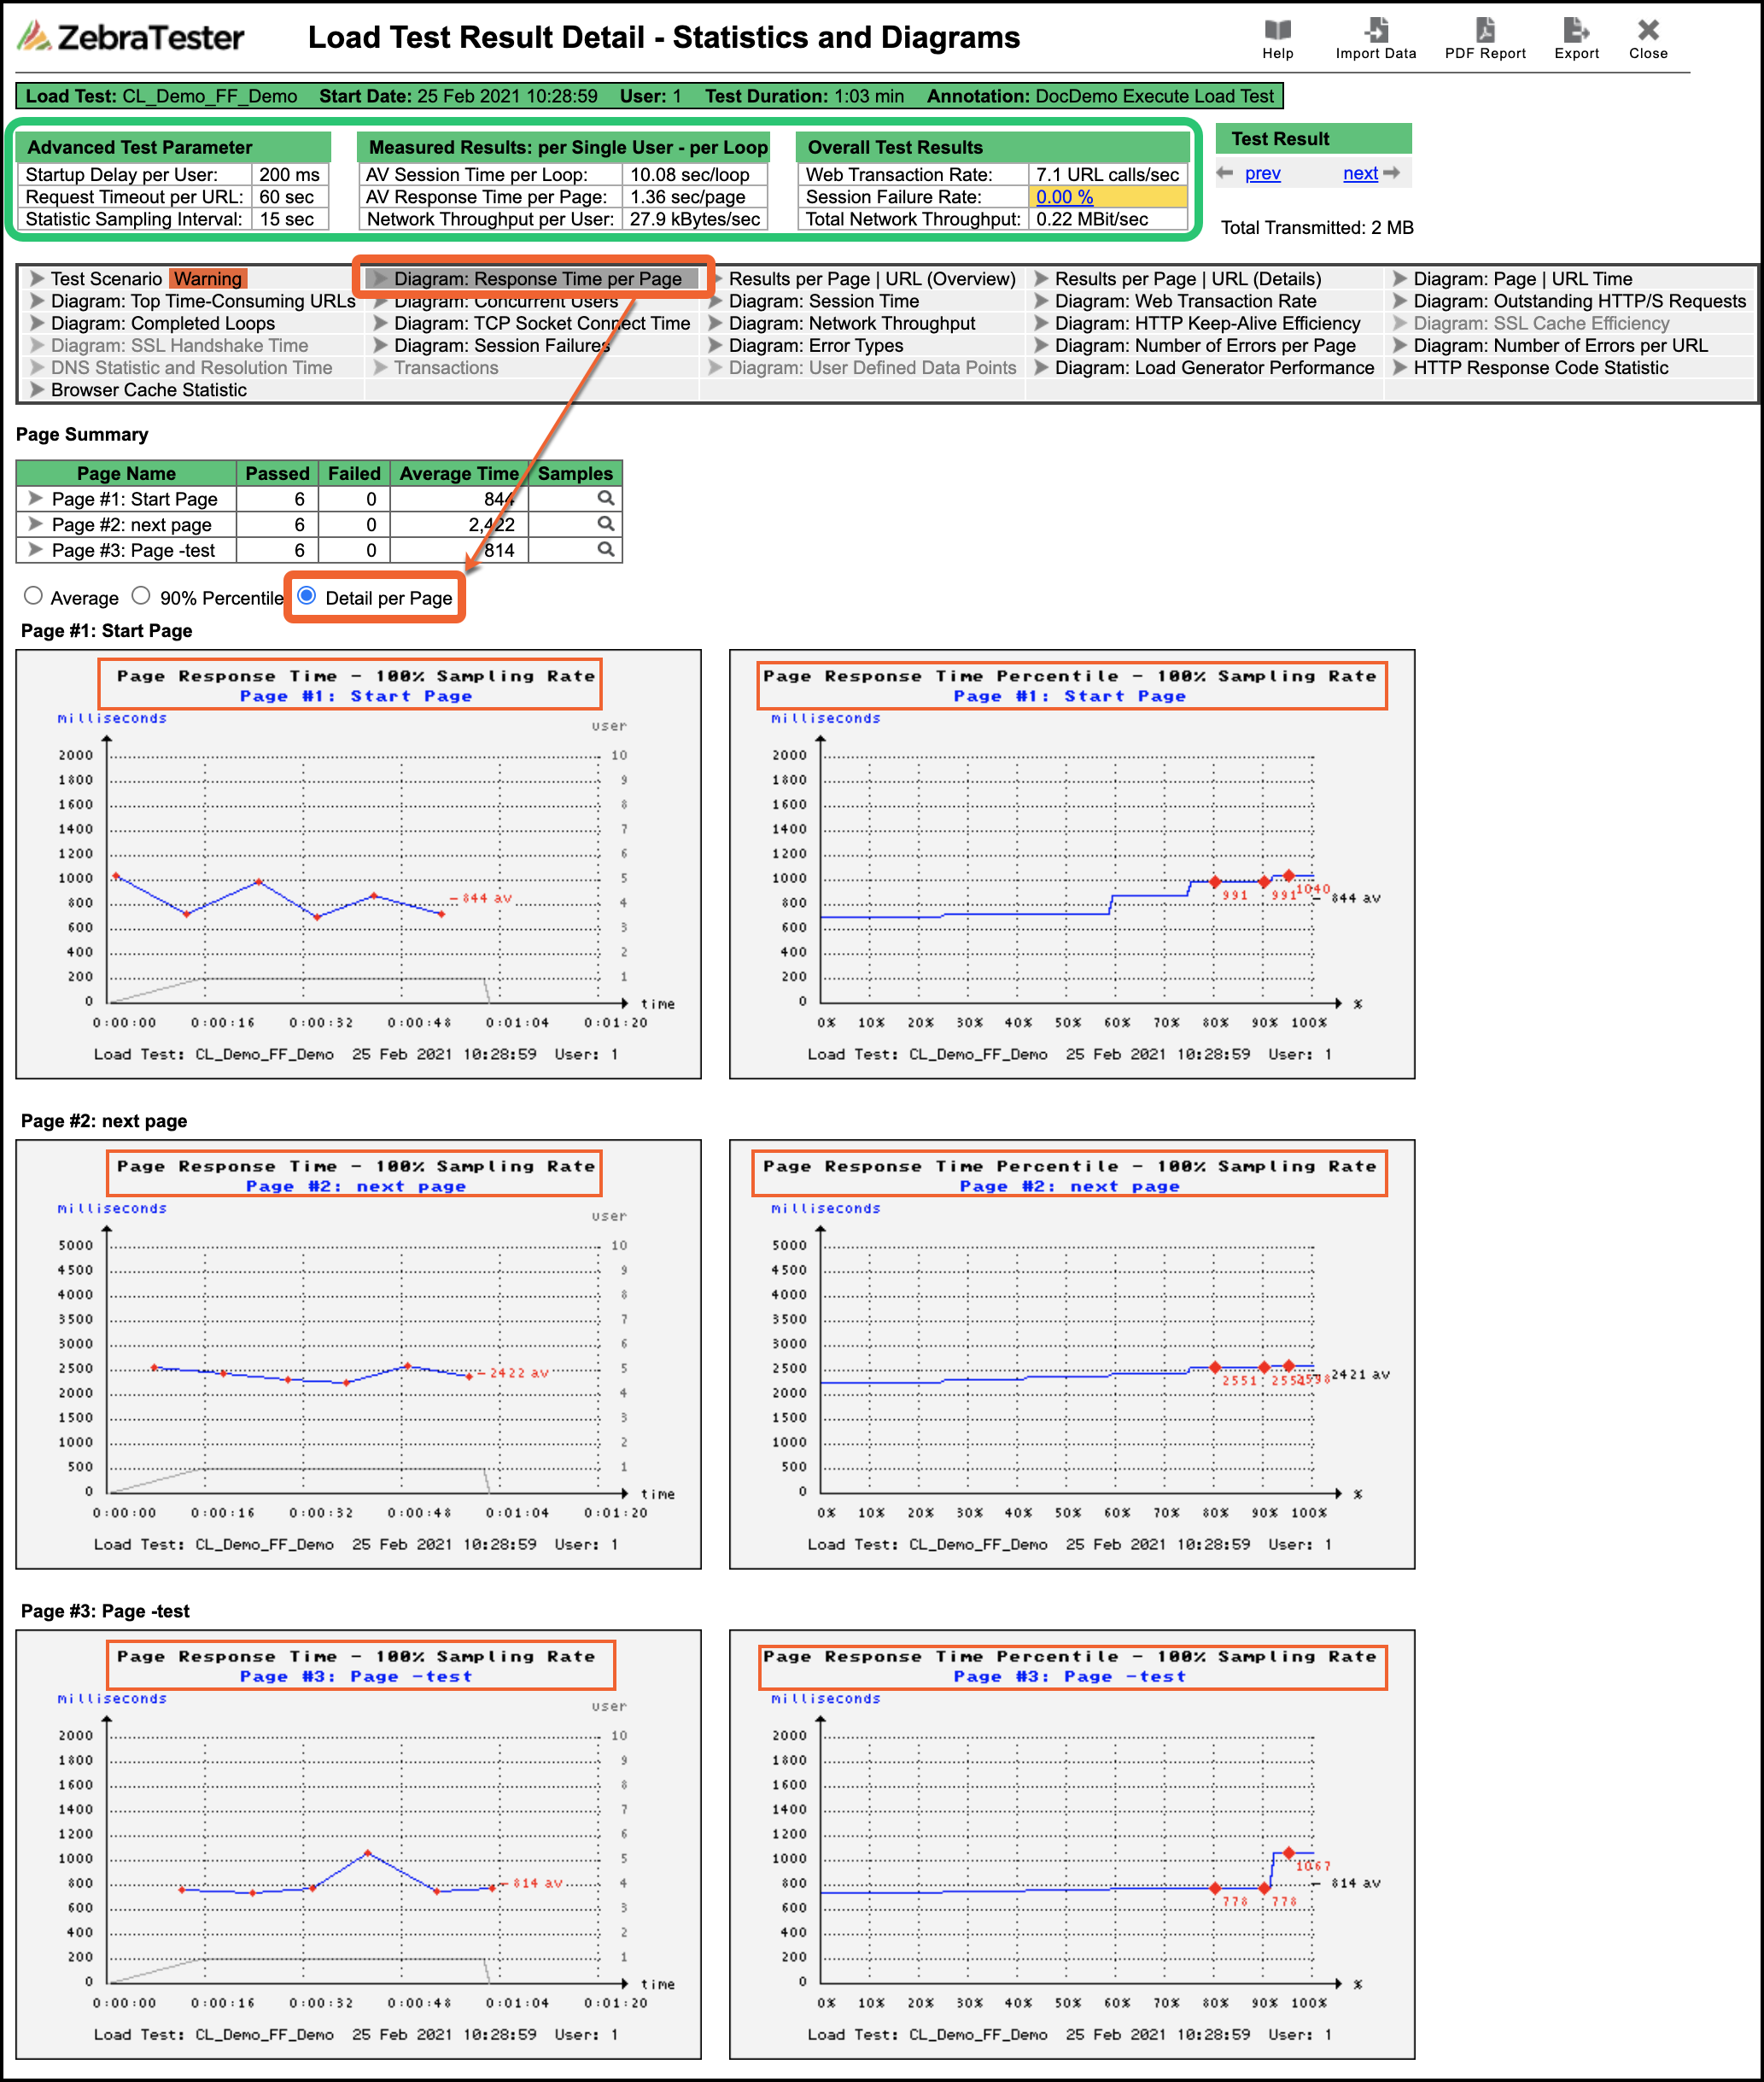 |
Results in Project NavigatorYou can filter for Load Test Results with to filter for .prxres Click the Analyze Load Test Result to open the Select and Compare Screen we saw above. This time, we can select two test results to compare them. | 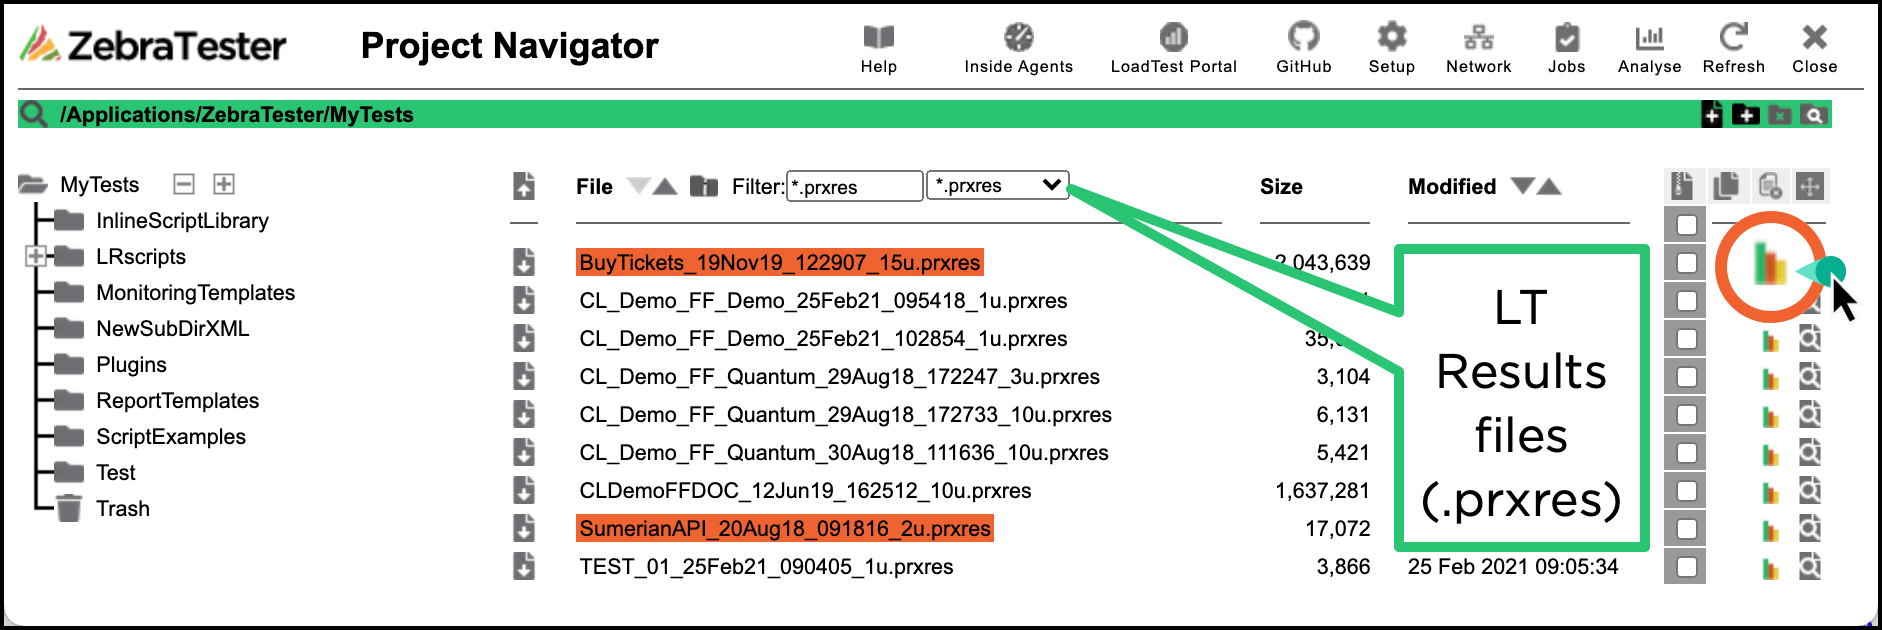 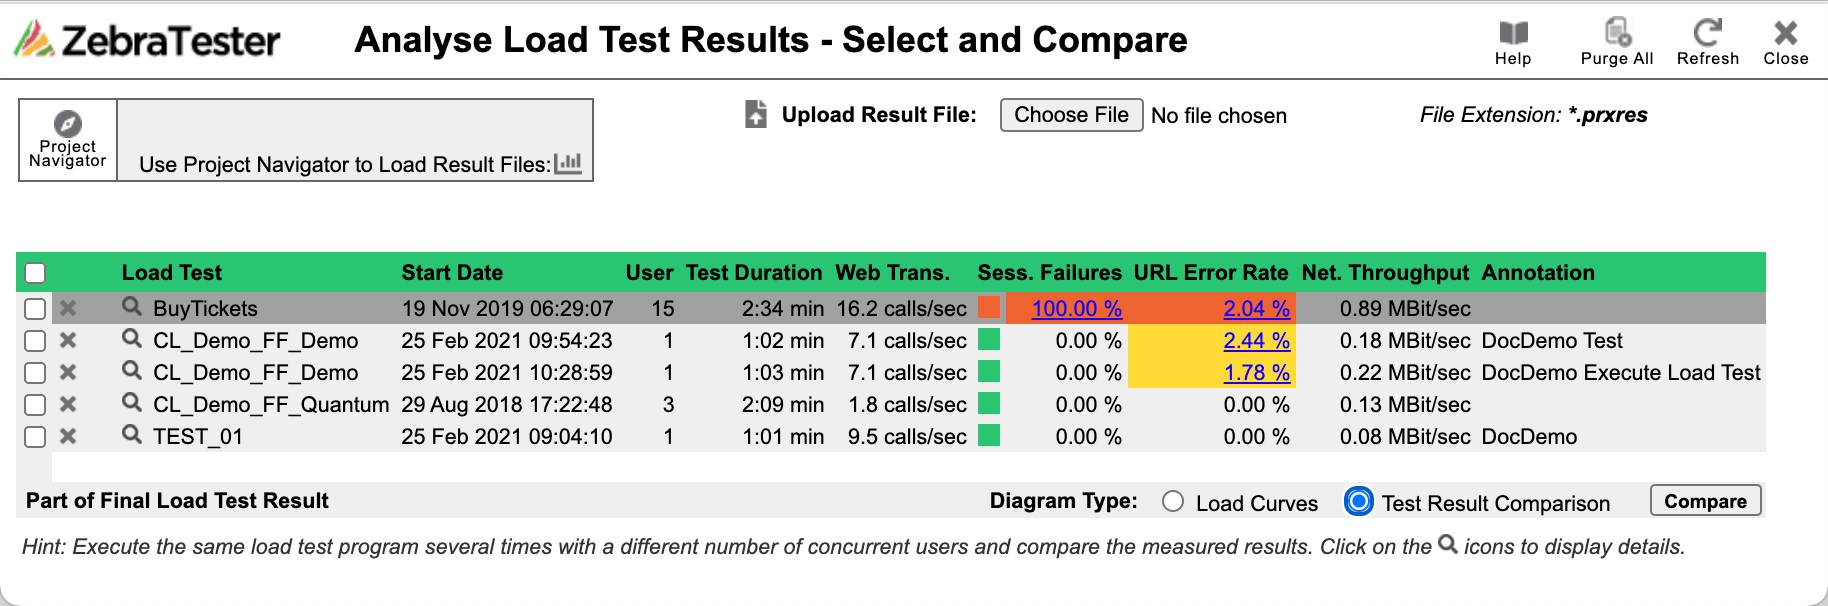 |
Example Analysis
We are seeing the same failed URL errors during the load tests, on the same page and on the same URL.
 |
 |
| Note |
|---|
|
In these cases, we strongly recommend reading the installed ZT manual about Handling "Dynamically-Exchanged Session Parameters" (Attached)
...