| Table of Contents |
|---|
Introduction
...
Executing a Load Test is started in the Project Navigator. The icon to the right of the *.class files will have a red arrow.
...
...
The icon to the right of the Job Template (*.xml) files will have a green arrow and will directly open a Start Load Test Job, which is covered here towards the end of this page).
...
If evaluating for browser performance, please select any Browser Emulation and Caching Options needed.
Execute LT Input Fields
Field | Description | ||||
|---|---|---|---|---|---|
Save as template | Stores all load test input parameters additionally inside an XML template. Later, this template can be used to rerun (repeat) the same load test. | ||||
Execute Test From | selects the Exec Agent or the Exec Agent Cluster from which the load test will be executed. | ||||
Apply Execution Plan | Optionally, an Execution Plan can be used to control the number of users during the load test. The dropdown list shows the Execution Plans' Titles, extracted from all formal valid Execution Plan files (*.exepl files), located in the current Project Navigator directory. Note that the titles of invalid Execution Plan files are not shown. If an Execution Plan is selected, then the following input parameters are disabled: Number of Concurrent Users, Load Test Duration, Max. Loops per User, and Startup Delay per User. | ||||
🔴 Number of Concurrent Users | The number of simulated, concurrent users. | ||||
🔴 Load Test Duration | The planned duration of the load test job. If this time has elapsed, all simulated users will complete their current loop (repetition of web surfing session) before the load test ends. Thus the load test often runs a little bit longer than the specified test duration. | ||||
Max. Loops per User | This limits the number of web surfing session repetitions (loops) per simulated user. The load test stops if the limit has been reached for each simulated user.
| ||||
Pacing | Minimum Loop duration per User. Enabling this option sets a minimum time for all in the iteration executed page breaks and URL calls which must be elapsed before the next iteration starts. | ||||
Startup Delay per User | The delay time to start an additional concurrent user (startup ramp of load). Used only at the start of the load test during the creation of all concurrent users. | ||||
Max. Network Bandwidth per User | The network bandwidth limitation per simulated user for the downlink (speed of the network connection from the webserver to the web browser) and the uplink (speed of the network connection from the web browser to the webserver). By choosing a lower value than "unlimited," this option allows simulating web users with a slow network connection. | ||||
Request Timeout per URL | The timeout (in seconds) per single URL call. If this timeout expires, the URL call will be reported as failed (no response from the webserver). Depending on the corresponding URL's configured failure action, the simulated user will continue with the next URL in the same loop, or it will abort the current loop and then continue with the next loop. | ||||
Max. Error-Snapshots | Limits the maximum number of error snapshots taken during load test execution. The maximum memory used to store error snapshots can be configured (recommended - for cluster jobs: value overall cluster members). The maximum number of error snapshots per URL can be configured (not recommended for cluster jobs: value per Exec Agent). | ||||
Statistic Sampling Interval | statistic sampling interval during the load test in seconds (interval-based sampling). Used for time-based overall diagrams like, for example, the measured network throughput.
| ||||
Additional Sampling Rate per Page Call | Captures the measured response time of a web page when a simulated user calls a web page (event-based sampling). Used to display the response time diagrams in real-time and in the Analyse Load Test Details menu. For endurance tests over several hours, it is strongly recommended that the sampling rate for web pages is set between 1% and 5%. For shorter tests, a 100% sampling rate is recommended.
| ||||
Additional Sampling Rate per URL Call | captures the measured response time of a URL each time when a simulated user calls a URL (event-based sampling). Used to display the response time diagrams in real-time and in the Analyse Load Test Details menu.
| ||||
In addition to capturing the URL calls' response time, further data can be captured using one of the Add options.
| --- recommended: no additional data are captured
| ||||
Debug Options Choosing any debug option (other than "none") affects that additional information is written to the *.out file of the load test job. The following debug options can be configured: | none - recommended | ||||
Additional Options Several additional options for executing the load test can be combined by adding a blank character between each of the options. The following additional options can be configured. | -multihomed Note 1: It could be needed that TLS SNI (Server Name Indication) must be disabled if a DNS translation table is used. Note 2: The HTTP request header field "Host" is not updated, so that you could call the Web server with the wrong hostname. -dnssrv <IP-name-server-1>[,<IP-name-server-N>] -dnsperloop | ||||
SSL: specifies which HTTPS/SSL protocol version should be used: | All: Automatic detection of the SSL protocol version. ZebraTester prefers the TLS 1.3 or TLS 1.2 protocol, but if the Web server does not support this, TLS 1.1, TLS 1.0, or SSL v3 is used. This is the normal behavior that is implemented in many Web browser products. v3: Fixes the SSL protocol version to SSL v3. | ||||
Browser Emulation User-Agents and Caching |
| ||||
🔴 Annotation | Enter a short comment about the test run, such as purpose, current web server configuration, and so on. This annotation will be displayed on the result diagrams. |
...
Starting Exec Agent Jobs
If you have specified that a single Exec Agent executes the load test program (but not by an Exec Agent Cluster), the load test program is transmitted to the local or remote Exec Agent, and a corresponding load test job - with a job number - is created locally within the Exec Agent. The job is now in the state “configured”; that is, ready to run, but the job is not yet started.
...
Real-time statistics shown in this window are updated every 5 seconds for as long as the load test job is running.
| Note |
|---|
Note:closing this window will not stop the load test job. If you close this window, you can later acquire the load test result or return to this dialogue (if the load test is still running) by clicking on the Jobs icon in the Main Menu or the Project Navigator window. |
...
Abort Job: Aborting a job will take a few seconds because the job writes out the statistic result file (
*.prxres) before it terminates.Suspend Job
Increase Users
Decrease Users
Abort Increase/Decrease Users
Extend Test Duration
Reduce Test Duration
...
Item | Description |
|---|---|
<Exec Agent Name> or <Cluster Name> | The Exec Agent's name - or the Exec Agent Cluster's name - executes the load test job. |
Job <number> | Unique job ID (unique per Exec Agent, or unique cluster job ID). |
Real-Time Comment | If real-time comments are entered during test execution, these comments are later displayed inside all time-based diagrams of the load test result detail menu. |
Job Parameter | The name of the load test program and the program arguments - test input parameter. |
Diagram | Description |
|---|---|
Web Transaction Rate 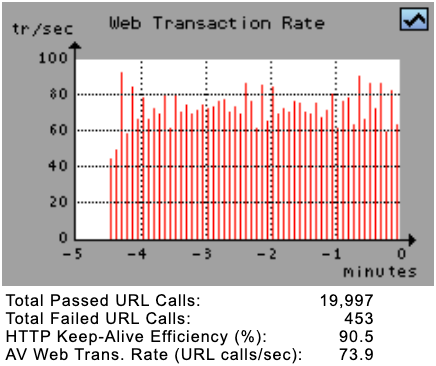 | The Web Transaction Rate Diagram shows the actual number of (successful) completed URL calls per second, counted overall simulated users. By clicking on this diagram, the Response Time Overview Diagrams are shown.
|
Session Failures / Ignored Errors 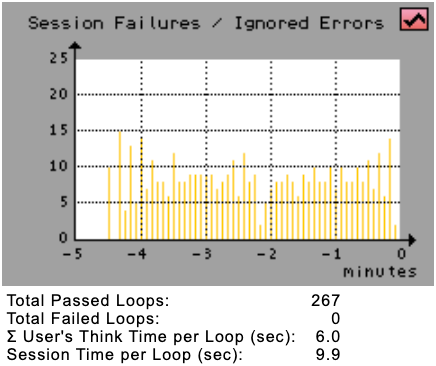 | The Session Failures / Ignored Errors Diagram shows the actual number of non-fatal errors (yellow bars) and the number of fatal errors (red bars = failed sessions) counted over all simulated users.
|
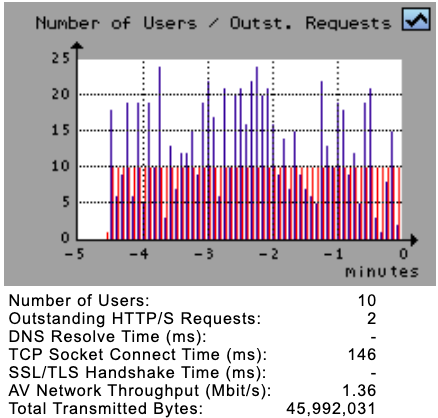 | The Number of Users / Waiting Users Diagram shows the total number of currently simulated users (red bars) and the actual number of users who are waiting for a response from the webserver (purple bars). The users waiting for a response is a subset of the currently simulated users. By clicking on this diagram, the Statistical Overview Diagrams are shown.
|
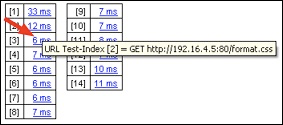
More actual measurement details are available by clicking on the Detailed Statistic button. Especially, an overview of the current execution steps of the simulated users is shown:
...
Please consider that maybe only a fraction of the response times are shown, depending on the Additional Sampling Rate per Page Call, which was selected when the load test was started. For example, only every fifth response time is shown if the Additional Sampling Rate per Page Call was set to 20%.
Input Fields
| Allows to select the period, from the current time back to the past, are shown in the diagrams within the response times. |
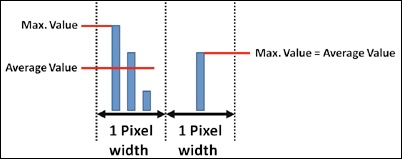
| Allows selecting if the bars inside the diagrams are shown as average values or as max. values. Please note that there is only a difference between the max. values and the average values if multiple measured samples of the response time fall inside the same pixel (inside the same displayed bar):. |
Diagram | Description |
|---|---|
| The tables at the right side of the diagrams contain the response times for all URLs of the web page. Also, these response times are either average values or max. values, depending on the selection in the Time Bars drop-down list. However, these values are calculated since the load test was started and always "accurately" measured, which means that they do not depend on the value chosen for the "Additional Sampling Rate per Page Call." |
 | You can click on a URL response time to show the corresponding URL Response Time Diagram. |
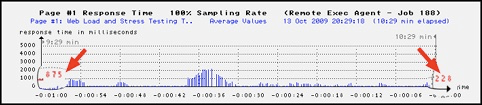 | On the left side inside the diagram, the web page's average response time is shown as red-colored text, calculated since the load test was started. But depending on the selected period, this value may not be displayed in every case. On the right side inside the diagram, the last measured value is shown. |
URL Response Time Diagram (Real-Time)
...
Please consider that maybe only a fraction of the response times are shown, depending on the Additional Sampling Rate per URL Call, which was selected when the load test was started. For example, only every fifth response time is shown if the "Additional Sampling Rate per URL Call" was set to 20%.
Input Fields
| Allows to select the period, from the current time back to the past, are shown inside the diagram within the response times. |
| Allows selecting if the bars inside the diagram are shown as average values or as max. values. Please note that there is only a difference between the max. values and the average values if multiple measured samples of the response time fall inside the same pixel (inside the same displayed bar). |
Info Box / Measured Values
...
All values in this infobox are calculated overall completed calls of the URL, measured since the load test was started. These values are always "accurately" measured, which means that they do not depend on the value chosen for the "Additional Sampling Rate per URL Call."
| the total number of passed calls for this URL. |
| the total number of failed calls for this URL. |
| the average size of the transmitted + received data per URL call. |
| the maximum response time ever measured. |
| the minimum response time ever measured. |
| the average time to open a new network connection to the webserver, measured for this URL. a blank /[ |
| the average time to transmit the HTTP request header + (optionally) the HTTP request content data (form data or file upload data) to the webserver, measured after the network connection was already established. |
| the average time for waiting for the first byte of the web server response (-header), measured since the request has (completely) transmitted to the webserver. |
| the average time for receiving the HTTP response header's remaining data, measured since the first byte of the response header was received. |
| the average time for receiving the response content data, for example, HTML data or the data of a GIF image. |
| the average response time for this URL. This value is calculated as \\. |
URL Errors / Real-Time Profile of Error Types: This diagram shows an overview of what kind of errors did occur for the URL at which time, measured since the load test was started. This "basic error information" is always "accurately" measured independently of the value chosen for the "Additional Sampling Rate per URL Call" - and captured in every case, also if no more memory is left to store full error snapshots.
...
Latest Error Snapshots: Displays a list of the latest (newest) errors. By clicking on a magnifier icon, the corresponding error detail information (error snapshot) is shown.
...
Input Fields
| effects that all errors about failed URL calls are shown (non-fatal and fatal errors). |
| effects that only fatal errors about failed URL calls are shown (session failures). |
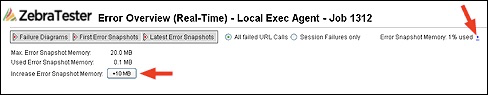
Error Snapshot Memory: % used +: By clicking on the + (plus sign), you can increase the amount of memory available to store error snapshots. Please Note: when the memory is already 50% or more used, no additional error snapshots for non-fatal errors are captured. This means that increasing the memory may also re-enable capturing for non-fatal errors.
...
Description: displays statistical overview diagrams (in real-time) about a load test job.
| Info |
|---|
Note: |
...
The values shown in the diagrams are captured at regular intervals, depending on the |
...
Statistic Sampling Interval |
...
, which was selected when the load test was started. |
...
| The total number of simulated users. |
| The number of users who are waiting for a response from the webserver. |
| The number of failed sessions - which is the same as the number of fatal errors. |
| The session time for one loop per simulated user. This value is the sum of "the response time of all URLs and all user's think times" per successfully completed loop. |
| The number of (successful) completed URL calls per second measured overall simulated users. |
| The number of (successful) completed loops (sessions) per minute measured overall simulated users. |
| The time in milliseconds (per URL call) to open a new network connection to the webserver. |
| The total network traffic which is generated by this load test job, measured in megabits per second. |
Real-Time Comments
Description: supports entering comments during the load test execution.
...
If a load test job has been completed, you will acquire the corresponding statistic result file (*.prxres). If a load test job is still running, you are disposed to the job's temporary live-statistic window.
Input Fields
| shows all Exec Agent Cluster jobs. |
| allows selecting the Exec Agent from which a list of all load test jobs is displayed. |
| deletes all jobs except running and scheduled jobs.\\. |
| deletes all completed jobs except the newest one. This button is only shown if, at minimum, two jobs have been completed. |
Columns of the job list:
Item | Description |
|---|---|
Job | Each job has its unique ID, which was automatically assigned when the job was defined. However, the ID is unique per Exec Agent. Cluster jobs have a known, separate ID (own enumeration counter). |
[Search Icon] | Allows to acquire the statistic result file ( |
[Delete Icon] | Deletes all data (-files) of a completed load test job. Consider that you must first acquire the statistic result file ( |
Date | Displays the date and time when the job has been defined or when the job has been completed, or - for scheduled jobs - the planned time when the job will be started. |
State | Displays the current job state: configured (ready to run), scheduled, running, or completed. The state "???" means that the job data are corrupted - you should delete all jobs which have the state "???" because they delay the display of all jobs in this list. |
Load Test Program & Arguments | Displays the name of the load test program and the arguments of the load test program. |
Released from GUI(IP) | Displays the TCP/IP address (remote computer) from which the job has been initiated. |
Load Test Program Arguments
Argument / Parameter | Meaning |
|---|---|
| Number of concurrent users |
| Planned test duration in seconds. 0 = unlimited |
| Request timeout per URL call in seconds |
| Startup delay between creating concurrent users in milliseconds |
| Max. number of loops (repetitions of web surfing session) per user. 0 = unlimited |
| Network bandwidth limitation per concurrent user in kilobits per second for the downlink (web server to web browser) |
| Network bandwidth limitation per concurrent user in kilobits per second for the uplink (web browser to the webserver) |
| Statistical sampling interval in seconds (interval-based sampling). Used for time-based overall diagrams like for example, the measured network throughput |
| Additional sampling rate in percent for response times of web pages (event-based sampling, each time when a web page is called) |
| Additional sampling rate in percent for response times of URL calls (event-based sampling, each time when a URL is called) |
| Max. number of error snapshots per URL (per Exec Agent), 0 = unlimited |
| Max. memory in megabytes which can be used to store error snapshots, -1 = unlimited |
| Replaces the recorded value of the HTTP request header field User-Agent with a new value. The new value is applied for all executed URL calls. |
| Disables writing any date to the |
| Debug failed loops |
| Debug loops |
| Debug headers & loops |
| Debug content & loops |
| Debug cookies & loops |
| Debug keep-alive for re-used network connections & loops |
| Debug information about the SSL protocol and the SSL handshake & loops |
| Forces the Exec Agent(s) to use multiple client IP addresses |
| Using this option combined with the option |
| Use fixed SSL protocol version: |
| The timeout of SSL cache in seconds. 0 = cache disabled |
| Disable support for TLS server name indication (SNI) |
| Effects: The load test job uses a known DNS hosts file to resolve hostnames rather than the underlying operating system's hosts file. Note that you have to ZIP the hosts file together with the load test program's compiled class. To automate the ZIP, it's recommended to declare the hosts file as an external resource (w/o adding it to the CLASSPATH). |
| Effects that the load test job uses specific (own) DNS server(s) to resolve hostnames – rather than to use the DNS library of the underlying operating system. |
| Enable consideration of DNS TTL by using the received TTL-values from the DNS server(s). This option cannot be used in combination with the option -dnsperloop. |
| Enable DNS TTL by using a fixed TTL-value of seconds for all DNS resolves. This option cannot be used in combination with the option -dnsperloop. |
| Perform new DNS resolves for each executed loop. All resolves are stable within the same loop (no consideration of DNS TTL within a loop). This option cannot be used in combination with the options -dnsenattl or -dnsfixttl. |
| Effects that statistical data about DNS resolutions are measured and displayed in the load test result using a known DNS stack on the load generators. Note: There is no need to use this option if any other, more specific DNS option is enabled because all (other) DNS options also effect implicitly that statistical data about DNS resolutions are measured. If you use this option without any other DNS option, the (own) DNS stack on the load generators will communicate with the default configured DNS servers of the operating system - but without considering the "hosts" file. |
| Time zone (see Application Reference Manual) |
| Comment about the test-run |
...
Scripting Load Test Jobs
Several load test jobs can be started from the GUI at the same time. However, the GUI does not have the ability to automatically run sequences of load test jobs, synchronize load test jobs, or automatically start several jobs with a single mouse click.
...
XML Load Test Template Attributes
Attribute Name | Description |
|---|---|
| Absolute file path to compiled load test program (*.class) or load test program ZIP archive |
| Name of the Exec Agent on which the load test is started (empty value if cluster job) |
| Name of the Exec Agent Cluster on which the load test is started (empty value if no cluster job) |
| Number of concurrent users |
| Planned test duration in seconds (0 = unlimited) |
| Number of planned loops per user (0 = unlimited) |
| Startup delay per user in milliseconds |
| Downlink bandwidth per user in kilobits per second (0 = unlimited) |
| Uplink bandwidth per user in kilobits per second (0 = unlimited) |
| Request timeout per URL call in seconds |
| Limits the number of error snapshots taken during load test execution (0 = unlimited). Negative value: maximum memory in megabytes used to store all error snapshots, counted overall Exec Agents (recommended). Positive value: maximum number of error snapshots per URL, per Exec Agent (not recommended). |
| Statistic sampling interval in seconds |
| Additional sampling rate per Web page in percent (0..100) |
| Additional sampling rate per URL call in percent (0..100) |
| Additional URL sampling options per executed URLcall (numeric value):<br>0: no options<br>1: all URLperformance details (network connect time, request transmit time, …)2: request header3: request content (form data)4: request header & request content5: response header6: response header & response content7: all – but without response content8: all – full URL snapshot |
| Debug options: (string value)“-dl”: debug loops (including var handler)“-dh”: debug headers & loops“-dc”: debug content & loops“-dC”: debug cookies & loops“-dK”: debug keep-alive & loops“-dssl”: debug SSL handshake & loops |
| Additional options (string) |
| SSL/HTTPS options: (string value)<br>“all”: automatic SSL protocol detection (TLS preferred)“tls”: SSL protocol fixed to TLS“v3”: SSL protocol fixed to v3“v2”: SSL protocol fixed to V2 |
| Annotation for this test-run (string) |
| Label, variable name, and the default value of User Input Fields |